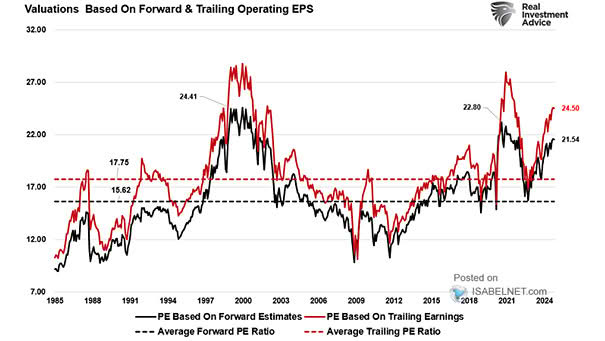
S&P 500 Valuation Multiples

S&P 500 Valuation Multiples Overvaluation in the S&P 500, especially among tech and AI stocks, is a legitimate concern in light of downward revisions to earnings estimates for 2025 and the high degree of index concentration. Image: Real Investment Advice

U.S. Stock Market Valuations – Combined P/E Ratio

U.S. Stock Market Valuations – Combined P/E Ratio High P/E ratios in U.S. tech stocks are a double-edged sword: they reflect both the sector’s growth potential and the risks of overvaluation driven by investor optimism. Image: Topdown Charts

Cyclicals vs. Defensives Performance

Cyclicals vs. Defensives Performance Cyclical sectors’ strong performance suggests economic optimism, but investors must be cautious about potential overvaluation and risks, especially when buying cyclical stocks late in the economic cycle. Image: Goldman Sachs Global Investment Research

S&P 500 Valuation vs. History

S&P 500 Valuation vs. History Compared to historical standards, most S&P 500 sector P/E valuations are elevated, raising concerns about potential market overvaluation. Image: Goldman Sachs Global Investment Research

Valuation Metrics

Valuation Metrics S&P 500 valuation metrics remain elevated by historical standards, raising concerns about potential market overvaluation. Image: Goldman Sachs Global Investment Research

Valuation – S&P 500 Long-Term P/E Ratio

Valuation – S&P 500 Long-Term P/E Ratio Valuation, particularly in the context of the S&P 500’s long-term P/E ratio, is a significant consideration for investors. The high current ratio suggests potential overvaluation. Image: The Daily Shot

S&P 500 Valuation – Real Market Capitalization to Real GDP Ratio

S&P 500 Valuation – Real Market Capitalization to Real GDP Ratio The inflation-adjusted market capitalization to GDP ratio is a valuable tool to evaluate the U.S. stock market’s valuation. The high current ratio implies a potential overvaluation. Image: Real Investment Advice

Valuation – U.S. Equity Market Capitalization to GDP

Valuation – U.S. Equity Market Capitalization to GDP The U.S. equity market cap to GDP ratio is near an all-time high at approximately 187%, suggesting a significant overvaluation of the U.S. stock market. Image: Goldman Sachs Global Investment Research

S&P 500 to M2 Ratio

S&P 500 to M2 Ratio The rising S&P 500 to M2 ratio suggests a potential overvaluation in the U.S. stock market. This trend implies greater demand for stocks compared to the supply of money, worrying investors and analysts. Image: Topdown Charts