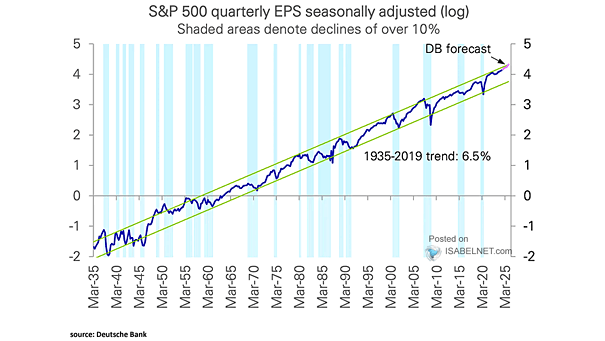
U.S. 10-Year Bond Yield and Long-Term Trend
U.S. 10-Year Bond Yield and Long-Term Trend This chart suggests that bond yields are well below their long-term trend. Image: Pictet Asset Management
S&P 500 Long-Term Trend and Expected Returns Chart suggesting that the 5 and 10-year return forecast is not very exciting. Image: Ned Davis Research
Long-Term Trends in the Price of Commodities This chart shows that a large pattern appears in the price of movements of commodities. Image: Visual Capitalist
Long-Term Bullish S&P 500 View A view of sector rotation suggests a long-term bullish trend for the S&P 500. Image: BofA Global Research
S&P 500 Real Total Return and Secular Trend The long-term trend of the S&P 500 Real Total Return shows no evidence of a bubble. Image: Fidelity Investments
The Stock Market’s Central Trend The chart shows that the S&P 500 is only 10% above its long-term trend since 1871. Image: Fidelity Investments
Inflation-Adjusted Investment in U.S. Stock Market This chart puts into perspective the long-term trend of the S&P 500 Total Return adjusted for CPI inflation (real CAGR = 6.7%). Image: Hondo Tomasz
U.S. Employment Rate 55+ The U.S. employment rate of older workers is increasing in a long-term trend. Image: Ernie Tedeschi
U.S. Long Bond This chart shows the U.S. long bond and its long-term trend line. Image: Fidelity Investments
U.S. 10-Year Treasury Bond Yield and U.S. 10-Year Nominal GDP The long-term trend in U.S. nominal GDP growth is a good indicator of U.S. nominal bond yields. Image: Goldman Sachs Global Investment Research