The Stock Market’s Central Trend
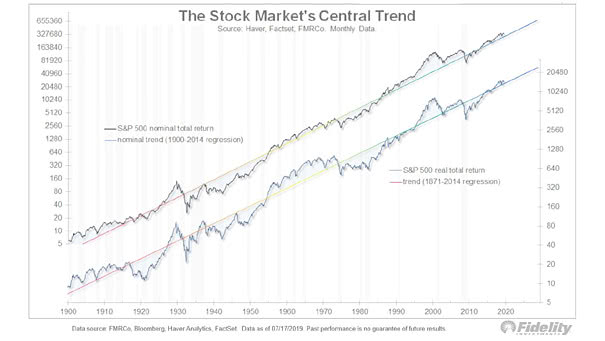
The Stock Market’s Central Trend The chart shows that the S&P 500 is only 10% above its long-term trend since 1871. Image: Fidelity Investments
The Stock Market’s Central Trend The chart shows that the S&P 500 is only 10% above its long-term trend since 1871. Image: Fidelity Investments
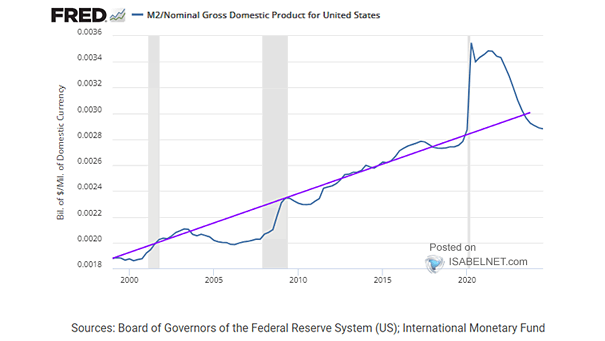
U.S. M2 to Nominal GDP Ratio The return of the U.S. M2 to nominal GDP ratio to its long-term trend is a positive indicator. It reflects a healthier balance between money supply and economic output, fostering stability and sustainable growth in the economy. Image: Federal Reserve Bank of St. Louis

S&P 500 Index – Bull vs. Bear Market Will the S&P 500 return to its all-time high as it remains in a long-term trending bull market? Image: Real Investment Advice
Inflation-Adjusted Investment in U.S. Stock Market This chart puts into perspective the long-term trend of the S&P 500 Total Return adjusted for CPI inflation (real CAGR = 6.7%). Image: Hondo Tomasz
U.S. Employment Rate 55+ The U.S. employment rate of older workers is increasing in a long-term trend. Image: Ernie Tedeschi
U.S. Long Bond This chart shows the U.S. long bond and its long-term trend line. Image: Fidelity Investments
U.S. 10-Year Treasury Bond Yield and U.S. 10-Year Nominal GDP The long-term trend in U.S. nominal GDP growth is a good indicator of U.S. nominal bond yields. Image: Goldman Sachs Global Investment Research
Real S&P 500 Index While geopolitical events can cause significant short-term market disruptions, their long-term impact is usually limited, and markets frequently rebound and continue their upward trajectory. Image: Real Investment Advice
S&P 500 Drawdown and Insider Buying/Selling The Vickers insider sell/buy ratio, which tracks corporate insider transactions, indicates insiders perceive value at current price levels—a trend historically viewed as a bullish signal for market direction. Image: Fidelity Investments
S&P 500 Ratio to Stoxx 600 The S&P 500’s performance relative to the Stoxx 600 has hit the upper limit of its long-term channel. While U.S. equities may continue to lead due to strong growth potential, economic shifts could alter this trend. Image: Deutsche Bank
G7 Inflation Average Current projections and trends suggest a return to 5% inflation is unlikely in the near term, but long-term structural changes and unforeseen shocks could alter this outlook. Image: BofA Global Investment Strategy