Days Since 5% Pullback From S&P 500 All-Time Highs
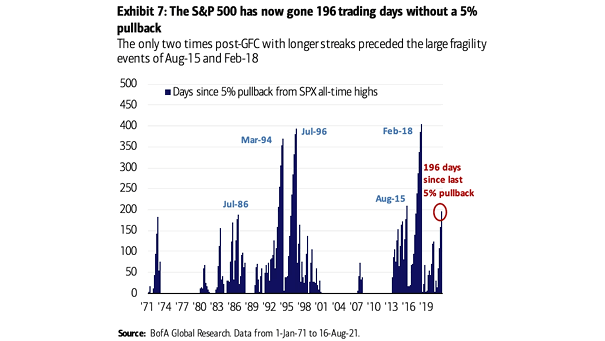
Days Since 5% Pullback From S&P 500 All-Time Highs The S&P 500 hasn’t seen as much as a 5% pullback since last October. Is a pullback approaching? Image: BofA Global Research
Days Since 5% Pullback From S&P 500 All-Time Highs The S&P 500 hasn’t seen as much as a 5% pullback since last October. Is a pullback approaching? Image: BofA Global Research
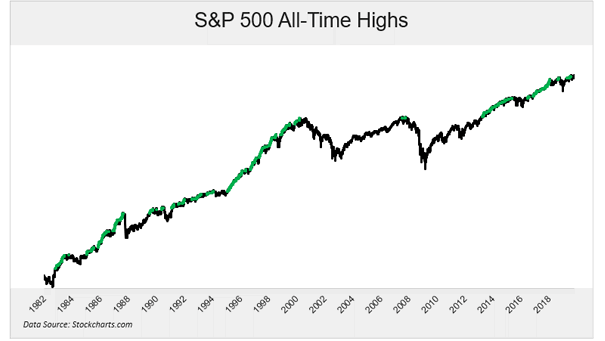
S&P 500 All-Time Highs Today, S&P 500 jumps to record high on strong earnings. This chart shows S&P 500 all-time highs since 1982. Image: Ritholtz Wealth Management LLC.

S&P 500 All-Time High and Inverted Yield Curve The S&P 500 tends to rise after an inverted yield curve. It has made new all-time highs 5 of 5 times the 10Y-2Y yield curve inverted. Image: Fundstrat Global Advisors, LLC
S&P 500 All-Time Highs Great chart showing the 1,140 all-time highs of the S&P 500 since the Second World War. Image: Ryan Detrick, LPL Financial LLC
S&P 500 Returns After New All-Time Highs Since 1990, despite periods of volatility, the S&P 500 has typically continued rising after new all-time highs, with a median 12-month gain of 13.5% and positive returns more than 82% of the time. Image: Carson Investment Research
New S&P 500 Index All-Time Highs Per Year The S&P 500 hit a new record high, driven by robust corporate earnings and optimism about economic growth. Such periods of record-breaking performance typically occur in clusters and frequently pave the way for additional gains. Image: Carson Investment Research
S&P 500 Performance After an All-Time High and Then Four Red Days in a Row The S&P 500 has fallen for four consecutive days after reaching a record high. Despite short-term challenges, the 12-month outlook remains positive, with positive returns 80% of the time and a median gain of 11.6% since 1990. Image: Carson Investment…
S&P 500 Performance After Fed Cuts Within 2% of All-Time Highs Bulls rejoice! Since 1980, when the S&P 500 was within 2% of its all-time high during a Fed rate cut, it has been positive 100% of the time over the following 12 months, with an average gain of 13.9%. Image: Carson Investment Research
S&P 500 Performance When >2% Daily Gain at an All-Time High Since 1950, the S&P 500 index has demonstrated robust performance in the year following a daily gain of over 2% at an all-time high, with a median increase of 12.4%. Image: Carson Investment Research
% of Days per Year to Make a New All-Time High for the S&P 500 The S&P 500’s performance this year reflects a strong bullish trend, with over one-fifth of trading days achieving new all-time highs, underscoring a favorable market environment. Image: Carson Investment Research
S&P 500 Returns After Fed Cuts Within 2% of an All-Time High When the S&P 500 is within 2% of an all-time high and the Fed cuts rates, historical data shows that the index has increased 100% of the time over the following 12 months since 1980, with an average return of 13.9%. Image: Carson…