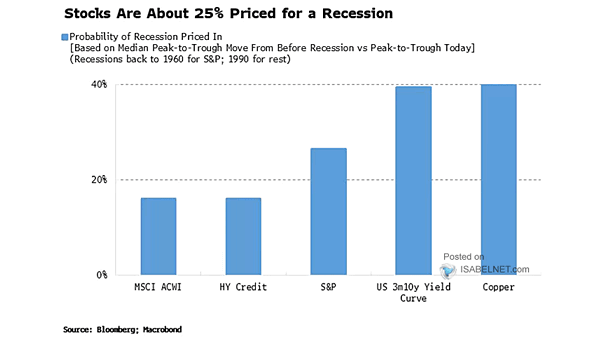
Probability of U.S. Recession As Priced Across Asset Classes

Probability of U.S. Recession As Priced Across Asset Classes The S&P 500 suggests a 26% probability of a recession in the United States, reflecting some concerns among investors. Analysts often use the current percentage change in the S&P 500 index to gauge the likelihood of an impending U.S. recession, given historical trends. On average, the…

Asset Classes – Valuation vs. History

Asset Classes – Valuation vs. History The current market environment reflects a contrast between relatively cheap commodities and expensive U.S. stock valuations. Image: Topdown Charts

Asset Class Returns

Asset Class Returns The dominance of U.S. large-cap stocks persists, with a strong return of 10.6% in Q1, outperforming other asset classes. This performance underscores the resilience and strength of the U.S. stock market. Image: J.P. Morgan Asset Management

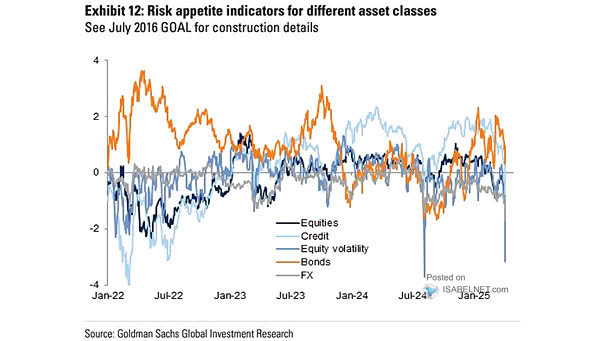
Risk Appetite Indicator for Different Asset Classes

Risk Appetite Indicator for Different Asset Classes The strong risk appetite of investors for credit investments indicates their confidence in the potential returns compared to other investment options. Image: Goldman Sachs Global Investment Research

Performance – What Is Likely to Be the Best-Performing Asset Class?

Performance – What Is Likely to Be the Best-Performing Asset Class? Historically, equities have demonstrated significant growth and the potential for attractive returns over the long term. Will equities be the best-performing asset class in 2024? Image: Goldman Sachs Global Investment Research

Asset Class Returns Forecasts

Asset Class Returns Forecasts Bank of America forecasts a soft landing and moderate growth for global equities in 2024. Image: BofA Global Research

Cumulative Inflows Across Asset Classes

Cumulative Inflows Across Asset Classes Cash is the flow winner in 2023. Will it serve as the driving force behind the bull markets of 2024? Image: BofA Global Investment Strategy

Asset Class Quilt of Total Returns

Asset Class Quilt of Total Returns Despite experiencing a significant selloff, the S&P 500 has managed to maintain its position as the top-performing asset since the start of the year, outperforming other investment options in the market. Image: BofA Global Investment Strategy Click the Image to Enlarge

Hard/Soft/No Landing Pricing Across Asset Classes

Hard/Soft/No Landing Pricing Across Asset Classes Investors may allocate cash to bonds in hard landing, a combination of stocks and credit in soft landing, commodities in no landing. Image: BofA Global Investment Strategy

Total U.S. ETF Flows by Asset Class

Total U.S. ETF Flows by Asset Class Inflows to U.S. ETFs are very strong this year, despite the bear market. Image: BofA ETF Research