U.S. Job Growth and Business Cycles
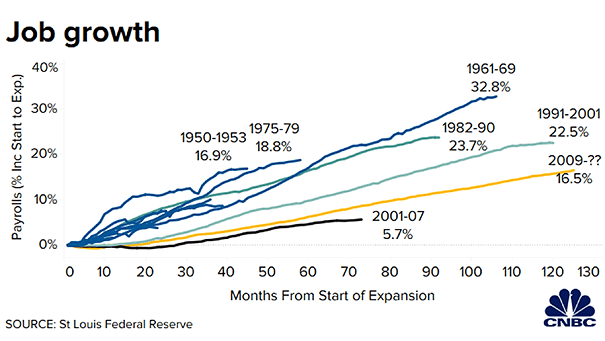
U.S. Job Growth and Business Cycles Chart showing that U.S. job growth has recovered more slowly than in previous cycles. Image: CNBC
U.S. Job Growth and Business Cycles Chart showing that U.S. job growth has recovered more slowly than in previous cycles. Image: CNBC
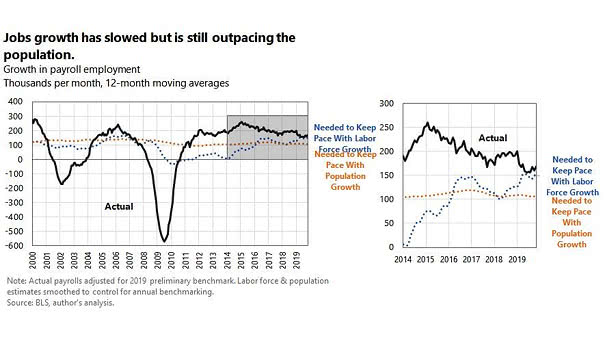
U.S. Job Growth vs. Population Growth and Recessions U.S. job growth continues to outpace population growth and does not point to an impending recession. Image: BLS

U.S. Job Growth by President Chart suggesting that President Trump is an “average” president on job growth. Image: Scotiabank Economics
U.S. Job Growth It is the 109th consecutive month of job growth. That’s a record. Image: Ryan Detrick, LPL Financial LLC
Where Has Job Growth Come from Since 2009? From a bachelor’s degree (58 millions), some college (37 millions) and high school graduates (36 millions). Actually, this interesting chart shows the importance of education in finding a job. Picture Source: Bianco Research
105 Consecutive Months of Job Growth It is the 105th consecutive month of job growth. The U.S. unemployment rate rose to 3.7%, but is still at historically low levels. Even if there are signs that the U.S. job market is slowing, it is still strong for the time being. Image: Leonard Kiefer
U.S. Job Openings vs. U.S. Implied Earnings Growth The decline in U.S. job openings may not bode well for earnings growth. Image: Morgan Stanley Wealth Management
Difference Between Number of Jobs Available and Number of Unemployed Americans vs. Annualized Wage Growth U.S. wage growth is expected to remain strong in the short run. Image: J.P. Morgan Asset Management
U.S. NonFarm Employment Annual Growth The YOY job growth rate of 1.1% is a warning sign, as similar levels have coincided with periods just before or during recessions since 1950, supporting the case for the Fed to consider easing monetary policy soon. Image: Paulsen Perspectives
Temporary Help Services Jobs vs. Real GDP and U.S. Recessions Temporary Help Services Jobs stand at -5.12% YoY in May. The relationship between Temporary Help Services jobs and the macroeconomy is complex. Declines in Temporary Help Services Jobs are often considered a leading indicator of a potential recession (red line at -3.5%), but they do…
Annual U.S. Payroll Employment Growth in the Month Before Each Post-War Recession The recent slowdown in U.S. job creation is concerning, as it nears levels typically seen before economic downturns. Image: Paulsen Perspectives