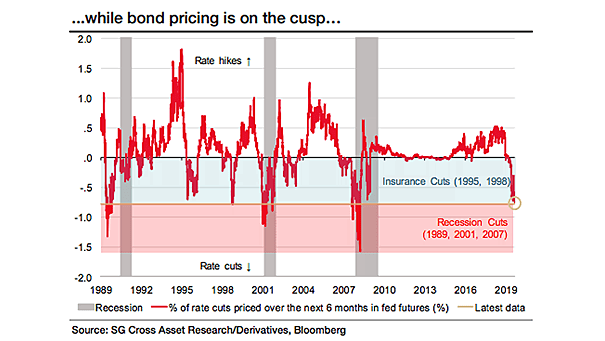
10-Year/2-Year Treasury Yield Curve Around First Fed Rate Cuts

10-Year/2-Year Treasury Yield Curve Around First Fed Rate Cuts The U.S. yield curve typically steepens once the prospect of interest rate cuts by the Fed becomes more imminent, rather than when the Fed actually stops hiking rates. Image: Goldman Sachs Global Investment Research

S&P 500 Pre and Post Fed Rate Cuts

S&P 500 Pre and Post Fed Rate Cuts The S&P 500 typically shows positive performance in the 12 and 24 months after the Fed’s first rate cut, unless the U.S. economy enters a recession. Image: Goldman Sachs Global Investment Research

Probability of Fed Rate Cut

Probability of Fed Rate Cut With signs of U.S. inflation cooling, can investors and traders expect the Federal Reserve to cut interest rates twice by the end of the year? Image: The Daily Shot

Fed Rate Cuts

Fed Rate Cuts 78% of FMS investors predict that there will be either 2, 3, or more Fed cuts over the next 12 months, reflecting their optimism about the likelihood of interest rate reductions. Image: BofA Global Fund Manager Survey

Market Pricing of Fed Rate Cuts

Market Pricing of Fed Rate Cuts Market’s expectations of Fed rate cuts have risen. Will the Fed make two rate cuts in 2024? Image: BofA Global Research

Fed Rates Cut

Fed Rates Cut Since the Fed’s last hike in July 2023, their ongoing 10-month pause is exceeding the average duration. Extended periods of “higher for longer” policies often lead to unfavorable outcomes. Image: Morgan Stanley Wealth Management

S&P 500 After Initial Fed Rate Cuts Outside Of Recession

S&P 500 After Initial Fed Rate Cuts Outside Of Recession Outside of recessions, U.S. stocks have tended to rise after the Fed’s first rate cut, with an average gain of 15% within 12 months. Image: BofA Predictive Analytics