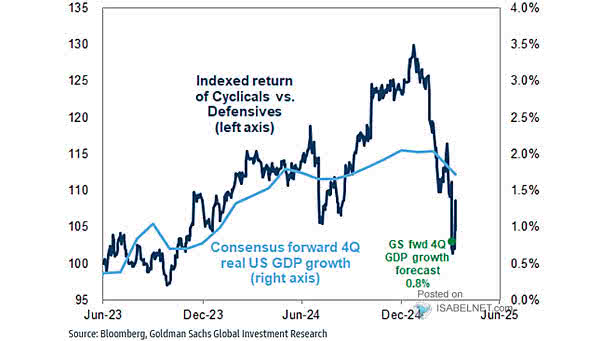
Indexed Return of Cyclicals vs. Defensives and Consensus Forward 4-Quarter U.S. GDP Growth

Indexed Return of Cyclicals vs. Defensives and Consensus Forward 4-Quarter U.S. GDP Growth Markets are betting on steady growth, not an economic boom. The gap between cyclicals and defensives implies roughly 2.4% US real GDP growth, broadly in line with Goldman Sachs’ forward 4Q GDP growth forecast. Image: Goldman Sachs Global Investment Research
Valuation – Shiller Cyclically-Adjusted S&P 500 Price-to-Earnings Ratio

Valuation – Shiller Cyclically-Adjusted S&P 500 Price-to-Earnings Ratio On the Shiller CAPE, U.S. stocks are back in the stratosphere, the kind that thrills investors on the way up and has a habit of burning them on the way down. Levels like this have a track record of slimmer returns and higher risk. Image: Goldman Sachs…

S&P 500 Cyclically-Adjusted P/E Ratio (CAPE) vs. S&P 500 Return on Equity (ROE)

S&P 500 Cyclically-Adjusted P/E Ratio (CAPE) vs. S&P 500 Return on Equity (ROE) Record profitability is helping justify elevated S&P 500 valuations, with trailing four-quarter ROE at 22%, a historic high. But if margins come under pressure and ROE slips, that support could quickly weaken. Image: Goldman Sachs Global Investment Research

Cyclical Minus Defensive Sectors Positioning

Cyclical Minus Defensive Sectors Positioning At the 52nd percentile, sector positioning shows a market in balance, with no meaningful shift toward either cyclicals or defensives, pointing to a lack of strong conviction. Image: Deutsche Bank Asset Allocation

Cyclicals vs. Defensives

Cyclicals vs. Defensives Cyclicals have become as pricey as defensives, leaving them vulnerable if confidence falters. Higher energy costs or trade disruptions could worsen the pressure by dampening activity. Image: Goldman Sachs Global Investment Research

Valuation – S&P 500 Shiller Cyclically-Adjusted P/E Ratio vs. Model-Predicted P/E Ratio

Valuation – S&P 500 Shiller Cyclically-Adjusted P/E Ratio vs. Model-Predicted P/E Ratio U.S. equities look expensive relative to both their own history and what today’s macro backdrop would normally justify. In past cycles, such stretches of pricey valuations have often been followed by years of subpar returns. Image: Goldman Sachs Global Investment Research

Cyclicals vs. Defensives – 12-Month Forward P/E Premium

Cyclicals vs. Defensives – 12-Month Forward P/E Premium Cyclical stocks are leading the way in 2025, leaving defensives behind as optimism returns to markets. In the U.S., that surge has lifted cyclicals to a valuation premium over safer plays. Image: Goldman Sachs Global Investment Research

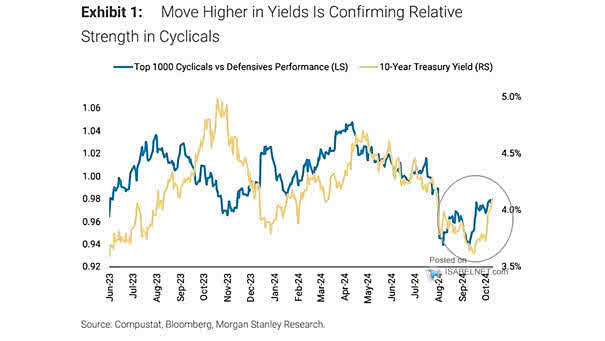
Cyclicals vs. Defensives Performance

Cyclicals vs. Defensives Performance Cyclical sectors’ strong performance suggests economic optimism, but investors must be cautious about potential overvaluation and risks, especially when buying cyclical stocks late in the economic cycle. Image: Goldman Sachs Global Investment Research