S&P 500 and Trend Channel
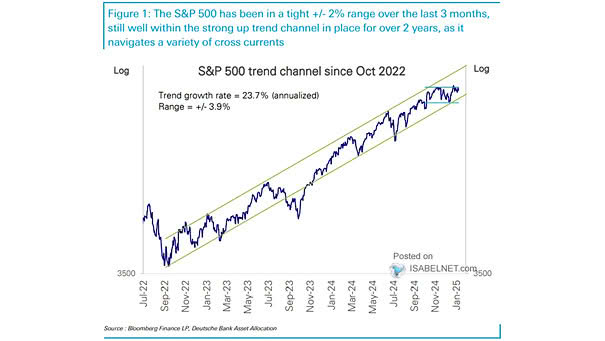
S&P 500 and Trend Channel The S&P 500 has maintained a strong upward trajectory since the Global Financial Crisis. Even if growth moderates, the long-term trend remains intact, suggesting continued strength in the index’s performance. Image: Deutsche Bank Asset Allocation