Inequality – Concentration of Equities Ownership by Wealth Class in the U.S.
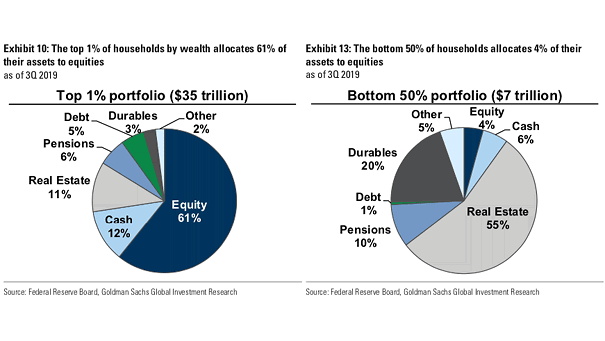
Inequality – Concentration of Equities Ownership by Wealth Class in the U.S. The top 1% of households owns equities, while the bottom 50% of households owns real estate. Image: Goldman Sachs Global Investment Research