Insider Transactions Ratio
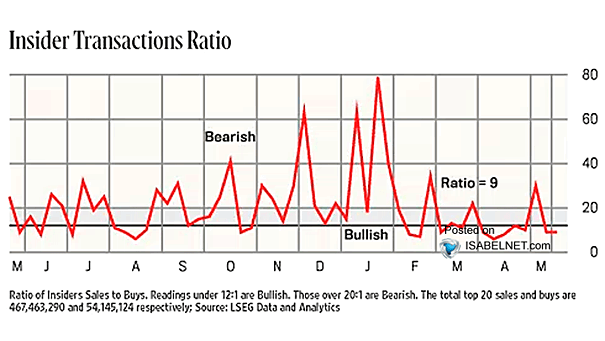
Insider Transactions Ratio The ongoing bearish trend in the Insider Transactions Ratio suggests that corporate insiders remain notably cautious. Image: Barron’s
Insider Transactions Ratio The ongoing bearish trend in the Insider Transactions Ratio suggests that corporate insiders remain notably cautious. Image: Barron’s
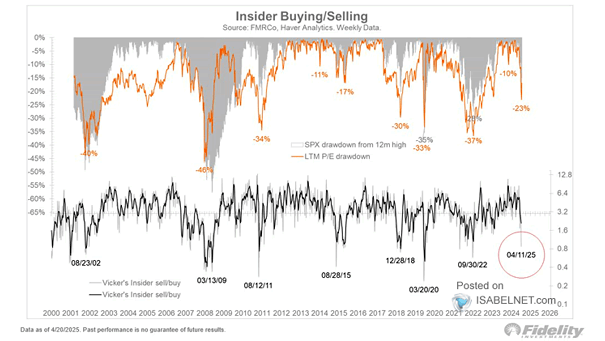
S&P 500 Drawdown and Insider Buying/Selling The Vickers insider sell/buy ratio, which tracks corporate insider transactions, indicates insiders perceive value at current price levels—a trend historically viewed as a bullish signal for market direction. Image: Fidelity Investments

Company Insider Buy-Sell Ratio As the S&P 500 continues its rally, corporate insider selling alone may not definitively predict a market downturn, but it can be a signal of executive caution or opportunistic profit-taking. Image: Bloomberg
S&P 500 – Net Insider Buying Insider buying tends to be highest around market lows, which is good news for the S&P 500. J.P. Morgan Equity Macro Research
Insiders Sales in U.S. Listed Companies Last month, U.S. executives sold stocks in their own companies as the S&P 500 rallies on. This is the biggest burst of selling since 2015. Image: Financial Times
Number of U.S. Corporate Insiders Buying Stock by Month Insiders are confident in an economic recovery and bought the dip in March. Image: Financial Times
S&P 500 and Insider Buy vs. Sell Ratio Insider buying is at its highest level in nine years, as executives are confident their businesses will recover. Image: CNBC
Insider Buy vs. Sell Ratio and S&P 500 Insider buying is at its highest level in nine years, but recent history shows that insiders tend to be early in picking the bottom. Image: Bloomberg
U.S. Insider Stock Sales and Recessions In the United States, insider stock sales rise at their highest level in about 20 years, as recession worries mount. Image: Financial Times