Economic Cycle – U.S. Economic Expansion
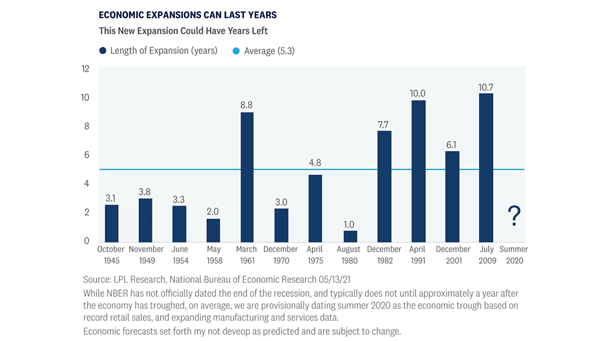
Economic Cycle – U.S. Economic Expansion Economic cycles of growth can last many years, with an average of more than five years. Image: LPL Research
Economic Cycle – U.S. Economic Expansion Economic cycles of growth can last many years, with an average of more than five years. Image: LPL Research
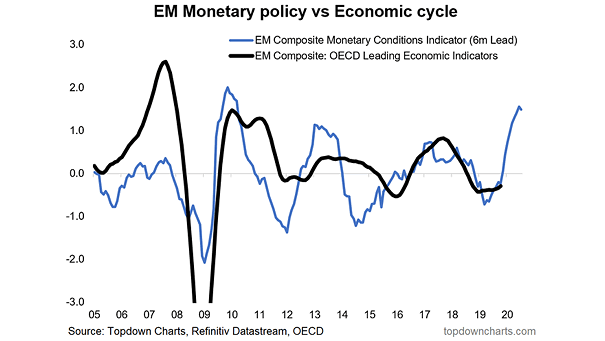
Emerging Markets Monetary Policy vs. Economic Cycle (Leading Indicator) Chart suggesting that EM monetary policy easing is likely to increase economic activity in the coming months. Image: Topdown Charts

ISM Manufacturing Index and Credit Returns Across Economic Cycles Since 2004 If investors get the ISM Manufacturing right, they do well. Image: J.P. Morgan Asset Management
Global Economic Cycle This chart suggests where countries stand in the current economic cycle. Image: Moody’s Analytics
U.S. Economic Cycles Since 1854 This chart puts into perspective the current U.S. economic cycle. Image: Societe Generale Cross Asset Research
The Credit Cycle Is Leading the Economic Cycle This great chart shows that an economic slowdows risk is rising. When delinquency rates on consumer loans reach a low, there’s a high probability of a recession on the horizon. Image: Deutsche Bank Global Research
U.S. Total Debt to GDP Ratio and Economic Growth by Cycle This nice chart clearly shows that U.S. GDP is weaker today than in the past, despite higher debt levels. Image: Real Investment Advice
S&P 500 vs. U.S. Economic Surprise – CPI Surprise The improving economic surprise index and favorable macroeconomic conditions suggest that U.S. equities may better withstand inflation compared to previous cycles. Image: BofA Global Research
Performance of Gold and Fed Cutting Cycles Federal Reserve interest rate cuts are often perceived as favorable for gold prices, particularly during periods of economic downturn. Image: Goldman Sachs Global Investment Research
U.S. Treasury Yields Since 2003 Including U.S. Cycles and Key Trends Chart suggesting that the current move in U.S. Treasuries coincide with the recovery phase of the U.S. economic cycle. Image: Morgan Stanley Research
Global Industrial Cycle and Copper vs. Equities Chart suggesting that copper should outperform equities in a global industrial rebound. Image: Oxford Economics