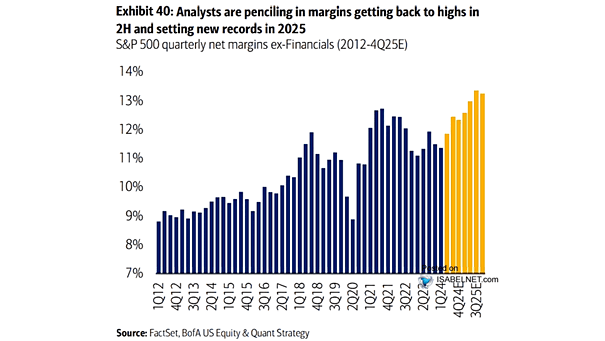
S&P 500 Quarterly Net Profit Margin (Ex. Financials & Energy)
S&P 500 Quarterly Net Profit Margin (Ex. Financials & Energy) Consensus forecasts indicate that S&P 500 profit margins will remain near record highs in 2025, supported by steady earnings growth and strong economic expansion. Image: Goldman Sachs Global Investment Research


