Was the US Stock Market Crash on October 19, 1987, a “Black Swan” Event?

Was the US Stock Market Crash on October 19, 1987, a “Black Swan” Event? A “Black Swan” is a metaphor that describes an event that comes as a surprise with a major effect, which is extremely difficult to predict. The theory was developed by Nassim Nicholas Taleb. The US stock market on October 19, 1987,…

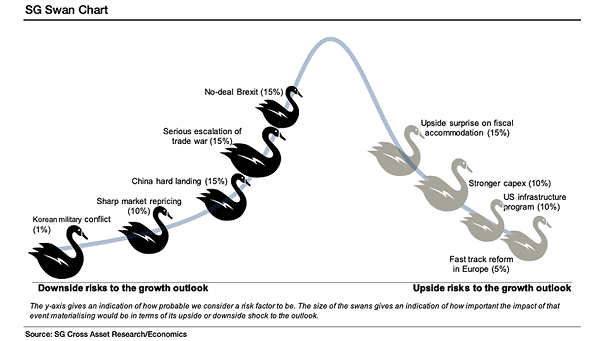
Societe Generale’s Chart of Swan Risks

Societe Generale’s Chart of Swan Risks This chart shows the downside and upside risks to the growth outlook. Biggest risks (black swan): protectionism/trade wars (25%), and European policy uncertainty (20%) Image: Societe Generale Cross Asset Research
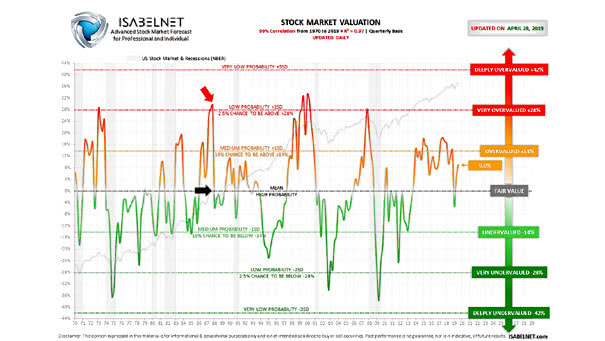
Stock Market Valuation

https://www.isabelnet.com/wp-content/uploads/2019/03/stock-market-valuation.mp4 This powerful model looks into the US stock market and alerts if it is overvalued or undervalued The model shows the valuation percentage to the right and to the left. In the middle, it shows what the probability of each event happening is. Probability is a way to show how often an event will…

Stock Market Equity Risk Premium

https://www.isabelnet.com/wp-content/uploads/2019/03/stock-market-equity-risk-premium.mp4 This fabulous model shows if the US stock market return for the next 10 years is more or less attractive than the 10-Year Treasury Note The US stock market equity risk premium is the US stock market excess return for the next 10 years over the US 10-year Treasury Note. This is the premium…