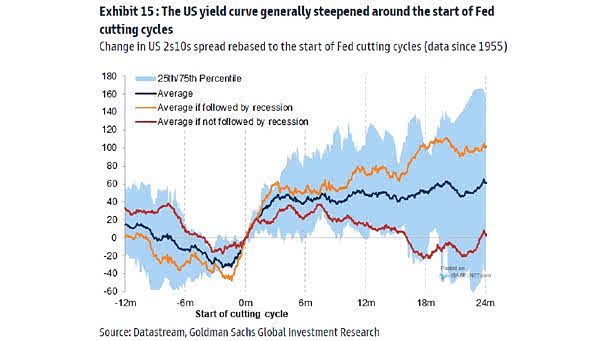
Citi Economic Surprise Index vs. 10-Year U.S. Treasury Yield

Citigroup Economic Surprise Index vs. 10-Year Treasury Yield This chart shows a good correlation between Citigroup Economic Surprise Index and 10-year Treasury yield. Lower yields ahead? You may also like “For the Last Few Years, Equity Markets Have Been Leading Bond Markets.” Image: Yardeni Research, Inc.

Treasury Volatility – MOVE Index

Treasury Volatility – MOVE Index The decrease in U.S. rates volatility around a 3-year low, as indicated by the MOVE index, could be viewed as a positive development for both the bond market and the overall economy. Image: Deutsche Bank

Long History of U.S. 10-Year Treasury Yields

Long History of U.S. 10-Year Treasury Yields Despite expectations of rate cuts, U.S. interest rates could move in either direction, depending on inflation and Fed decisions. Image: Goldman Sachs Global Investment Research Click the Image to Enlarge

10-Year U.S. Treasury Yield vs. U.S. Dollar Index (DXY)

10-Year U.S. Treasury Yield vs. U.S. Dollar Index (DXY) While the strong relationship between U.S. Treasury yields and the dollar has lasted for over a year, investors should remain aware that market dynamics can shift rapidly. Image: Morgan Stanley Research

Two-Month Correlation Between Bloomberg U.S. Treasury Index and S&P 500 Index

Two-Month Correlation Between Bloomberg U.S. Treasury Index and S&P 500 Index The current positive correlation between stocks and bonds emphasizes the need for investors to diversify beyond traditional assets and adopt more sophisticated risk management strategies. Image: Morgan Stanley Wealth Management

U.S. 10-Year Treasury Term Premium

U.S. 10-Year Treasury Term Premium The increasing term premium suggests investors require greater compensation for longer-term bonds, reflecting heightened interest rate and inflation risks associated with extended durations. Image: Morgan Stanley Wealth Management

Average U.S. 10-Year Treasury Yield Performance in Fed Rate Cut Cycles

Average U.S. 10-Year Treasury Yield Performance in Fed Rate Cut Cycles Since 1966, the current Fed easing cycle has resulted in the second-worst performance of 10-year U.S. Treasury bonds. The only period with worse performance was in 1981, during Chairman Paul Volcker’s aggressive measures to combat inflation. Image: Deutsche Bank

10-Year U.S. Treasury Yield Fair Value

10-Year U.S. Treasury Yield Fair Value The fair value model for the 10-year U.S. Treasury yield, based on market variables, suggests a fair value close to 4.10%. Image: Deutsche Bank