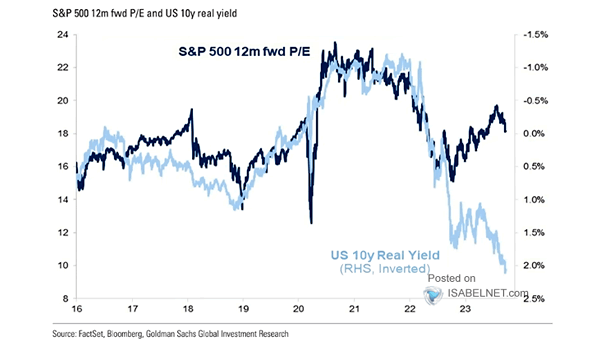
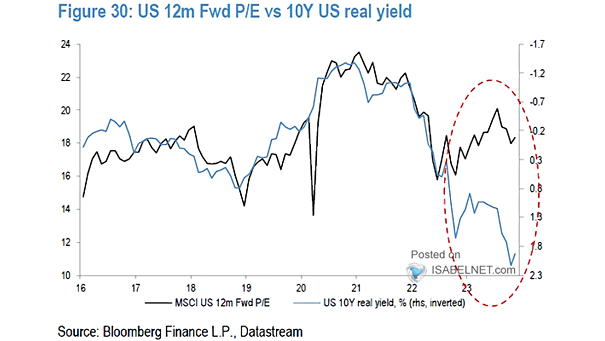
Valuation – S&P 500 Forward P/E and 10-Year U.S. Real Yield
Valuation – S&P 500 Forward P/E and 10-Year U.S. Real Yield Higher real rates tend to suggest a lower S&P500 forward P/E multiple. Image: Goldman Sachs Global Investment Research
Valuation – 10-Year U.S. Treasury Real Yield vs. S&P 500 Forward Price/Earnings Ratio Despite higher real rates, the S&P 500’s valuation remains elevated. Image: Morgan Stanley Wealth Management
Gold Price vs. 10-Year U.S. Treasury Real Yield Rising real yields (inverted) did not have a major impact on the price of gold last year. Image: Morgan Stanley Wealth Management
S&P 500 and U.S. 10-Year Real Yield Should investors remain bearish on the S&P 500? Image: Morgan Stanley Research
Real Rates – U.S. Agg. Corporate Avg. Option-Adjusted Spread and 10-Year U.S. Real Yield Rising U.S. real rates could lead to wider credit spreads. Image: Morgan Stanley Wealth Management
Rates – U.S. 10-Year Nominal and Real Yields Goldman Sachs expects U.S. rates will continue to rise. Image: Goldman Sachs Global Investment Research
Gold vs. U.S. 10-Year Real Yields and U.S. Dollar Index – 3-Month Correlation of Weekly Return Generally, U.S. 10-year real yields and the U.S. dollar are negatively correlated with the price of gold. Image: Goldman Sachs Global Investment Research
Manufacturing PMIs and U.S. 10-Year Real Yield (Leading Indicator) Manufacturing PMIs tend to lead U.S. 10-year real yields by 6 months. Image: MarketDesk Research
Inflation – Real Estate Real Dividend Yield vs. TIPS Real Yield Real estate real dividend yields remain attractive relative to TIPS real yields. Image: BofA US Equity & Quant Strategy
U.S. High Yield – % $HY Negative Real Yield How long will U.S. junk bonds with negative real yields last? Image: Deutsche Bank