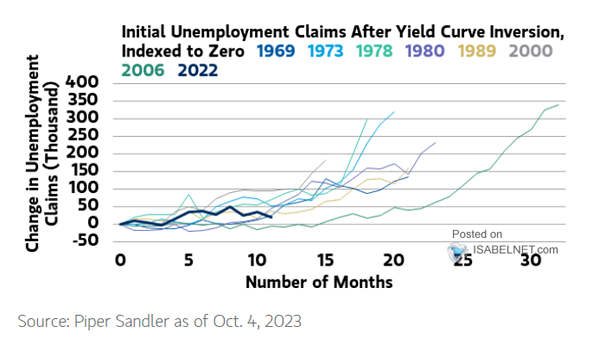
Yield Curve Inversions and U.S. Recessions
Yield Curve Inversions and U.S. Recessions The table shows the significant lag between the first inversion date and the onset of the recession in the United States. Image: Jeroen Blokland
10Y-2Y Yield Curve Inversion Until U.S. Recession Starts An inverted yield curve doesn’t always mean that a recession is imminent. But historically, a sustained yield curve inversion has been a good indicator of recession. Image: Legg Mason
Recessions After U.S. 10Y-3M Yield Curve Inversion and S&P 500 Market Peaks Prior to NBER Recessions Analysis based on the 10Y-3M yield curve inversion, suggesting the S&P 500 peak-to-trough in percentage terms, and NBER recession start and end dates. Image: Pictet Asset Management
10Y-2Y Yield Curve Inversion vs. S&P 500 Peaks Chart suggesting that the S&P 500 Index should not peak until June 2020. In recent history, the S&P 500 Index peaks 10 months on average after the 10Y-2Y yield curve inverts. Image: Jeroen Blokland
U.S. Unemployment Change and Real Interest Rate at Time of Yield Curve Inversion Looking at real interest rates can provide some insight about the severity of a recession before it starts. This chart suggests that unemployment could increase significantly during the next recession.
10Y-3M Yield Curve Inversion and S&P 500 Operating EPS The inversion of the yield curve between 3-month and 10-year Treasurys is not good news for S&P 500 operating EPS (90D means 3-month T-bill). The 50 day moving average removes false signals since 1967. Image: Stifel
ISM Manufacturing Index and U.S. Yield Curve Inversion This chart suggests that the ISM Manufacturing Index tends to trough 19 months after the U.S. (10Y-3M) yield curve inverts. Image: Pictet Asset Management
S&P 500 Average Performance -2Y/+2Y with U.S. Yield Curve Inversion History tells us that on average, the S&P 500 peaks 42 weeks after (10Y-3M) yield curve inversion. Image: Pictet Asset Management
Time from 2s-10s Yield Curve Inversion until Recession Starts Recession tends to start in one to three years after the yield curve inversion. The yield curve is only one indicator among others of an economic puzzle. Image: Deutsche Bank Global Research
S&P 500 Performance and Yield Curve Inversions Past yield curve inversions preceded top in SPX by about 11 months. Image: J.P. Morgan