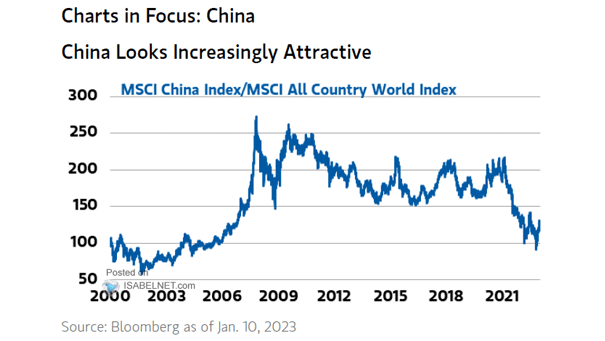
Equity – MSCI China Index / MSCI All Country World Index
Equity – MSCI China Index / MSCI All Country World Index Should investors overweight Chinese stocks? Image: Morgan Stanley Wealth Management
Equity – MSCI China Index / MSCI All Country World Index Should investors overweight Chinese stocks? Image: Morgan Stanley Wealth Management
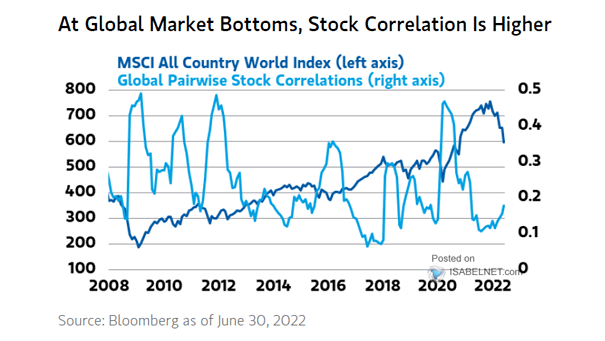
MSCI All Country World Index and Global Pairwise Stock Correlations The bear market bottom is probably not yet in, as stock correlation is higher at global market bottoms. Image: Morgan Stanley Wealth Management

MSCI All Country World Index (MSCI ACWI) – Value Minus Growth, One-Day Change Should investors forget growth stocks, as value investing is back in play? Image: Morgan Stanley Wealth Management
MSCI All Country World Index (ACWI) Dividend Yield Less U.S. 10-Year Yield When the spread has been greater than 1%, it has been a good support for the MSCI All Country World Index. Image: Exane BNP Paribas
MSCI All Country World Index (ACWI) – Period of Consolidation Exane is bullish and suggests that the MSCI ACWI might be nearing an end to this period of consolidation. Image: Exane BNP Paribas
MSCI All Country World Index (ACWI) Leads Global GDP This chart suggests that the MSCI All Country World Index (ACWI) leads Global GDP by 6 months. Image: Ken Fisher
MSCI All-Country World Index and RSI (14) Signs of overheating are emerging in global stocks, with technical and flow indicators nearing thresholds that have previously triggered sell signals. Image: Bloomberg
Trade-Weighted U.S. Dollar Index and U.S. 30-Year T-Bond Price vs. MSCI All-Country World Will the safe haven U.S. dollar continue to rise amid Delta COVID variant outbreak? Image: BCA Research
Market – Geographical Breakdown of MSCI World Index Constituents The combined market capitalization of the Magnificent Seven would make it the second-largest country stock exchange globally. This would surpass the total value of many thriving economies. Image: BofA Global Research
Currency Impact on International Returns (MSCI ACWI ex-U.S.) Chart showing the currency impact on the MSCI All Country World ex-U.S. Index. Image: J.P. Morgan Asset Management