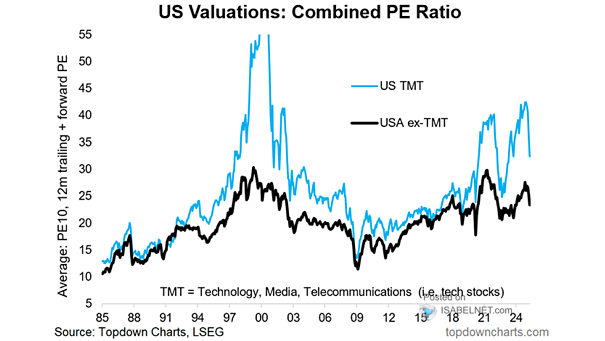
Developed Market Valuations
Developed Market Valuations While the macroeconomic outlook has weakened, the U.S. stock market’s forward P/E ratio has moved back toward pre-Liberation Day levels. Image: TS Lombard
U.S. Stock Market Valuations – Combined P/E Ratio High P/E ratios in U.S. tech stocks are a double-edged sword: they reflect both the sector’s growth potential and the risks of overvaluation driven by investor optimism. Image: Topdown Charts
U.S. Stock Market Valuation – Cape Ratio The S&P 500’s CAPE ratio remains historically high, which could potentially lead to lower subsequent returns over the following 10 years. Image: Real Investment Advice
FMS Investors and Stock Market Valuation Is the stock market overvalued? Large number of FMS investors still think stock market is “overvalued” at 71%. Image: BofA Global Fund Manager Survey
U.S. Market Valuation Chart suggesting that the U.S. stock market seems expensive in a number of ways. Image: Paolo Cardena
Emerging Market Valuations Chart suggesting that emerging market valuations are not cheap for bargain investors. Image: J.P. Morgan
Why the Stock Market Valuation Matters Before a Recession? When the stock market is VERY overvalued before a recession, it tends to be VERY undervalued. Like the swing of a pendulum, or the stretching of a rubber band, sooner or later it comes back very violently. This happened in 1973, 2000 and 2008. The US…
https://www.isabelnet.com/wp-content/uploads/2019/03/stock-market-valuation.mp4 This powerful model looks into the US stock market and alerts if it is overvalued or undervalued The model shows the valuation percentage to the right and to the left. In the middle, it shows what the probability of each event happening is. Probability is a way to show how often an event will…
Valuation – Market Capitalization of Stock Market / M2 Money Supply The current high market capitalization of U.S. equities relative to M2 suggests that investors are anticipating very optimistic future earnings and a stable economic outlook. Image: Gavekal, Macrobond
S&P 500 – Factor Signal for Market Peaks Based on Quality, Momentum, and Valuation The combination of quality and momentum factors outperforming vs. history, along with elevated valuations, could signal that the market is approaching a peak, prompting investors to adjust their portfolios accordingly. Image: BofA US Equity & Quant Strategy
S&P 500 Valuation – Real Market Capitalization to Real GDP Ratio The inflation-adjusted market capitalization to GDP ratio is a valuable tool to evaluate the U.S. stock market’s valuation. The high current ratio implies a potential overvaluation. Image: Real Investment Advice