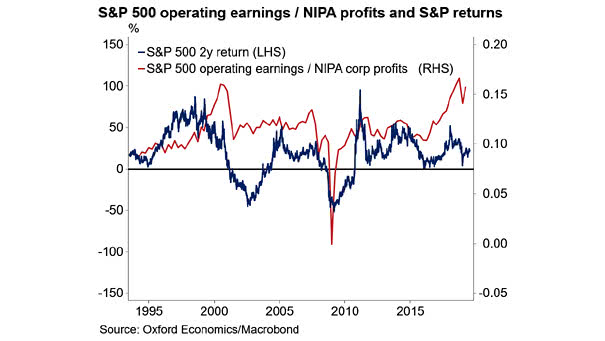
S&P 500 Operating Earnings / NIPA Profits and S&P 500 Returns
S&P 500 Operating Earnings / NIPA Profits and S&P 500 Returns Interesting chart suggesting that S&P500 2-year returns will be negative, as they were in the late 1990s, when S&P 500 operating earnings rose relative to NIPA profits (thanks to buybacks). Image: Oxford Economics, Macrobond