Utilities Flows
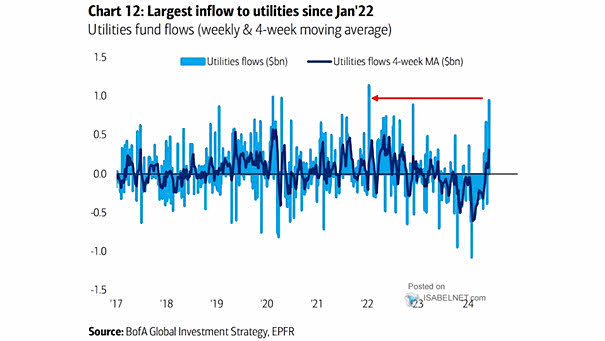
Utilities Flows Utility funds continue to attract strong inflows, making them a popular choice for investors seeking stable and predictable returns. Image: BofA Global Investment Strategy
Utilities Flows Utility funds continue to attract strong inflows, making them a popular choice for investors seeking stable and predictable returns. Image: BofA Global Investment Strategy
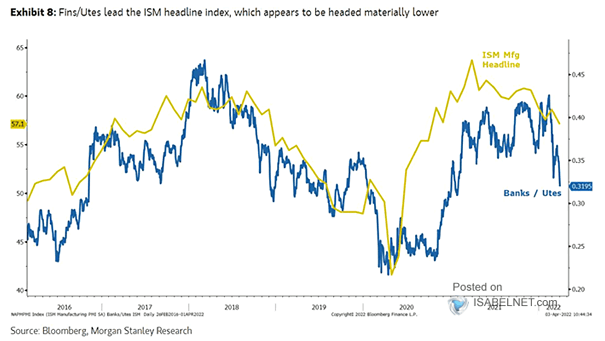
ISM Manufacturing Index vs. Banks / Utilities (Leading Indicator) Will the ISM Manufacturing Index move downward from current levels? Image: Morgan Stanley Research

Utilities Dividend Yield Less 10-Year U.S. Treasury Yield Goldman Sachs upgraded utilities to outperform, as the utilities dividend yield is relatively high compared to the 10-year U.S. Treasury yield. Image: Goldman Sachs Global Investment Research
Valuation: Utilities vs. Tech vs. S&P 500 Nice chart showing the valuation of utilities vs. Tech and the S&P 500. Currently, utilities are valued at 19.9x forward EPS, tech at 18.7x, and the S&P 500 at 16.4x Image: Fidelity Investments
Utilities-to-Gold & Silver Mining Stocks Ratio Since 1990 S&P 500 Utility Sector to Philadelphia Gold and Silver Index hits all-time high. Image: Crescat Capital LLC
GWIM 4-Week ETF Flows as % of AUM BofA’s private clients have been buying Japan, utilities, HY ETFs, and selling TIPS, materials, precious metal ETFs over the past four weeks. Image: BofA Global Investment Strategy
FMS Investor Positioning FMS investors have overweighted their exposure to utilities and US/EM/UK, while reducing their exposure to the Eurozone, commodities, and consumer. Image: BofA Global Fund Manager Survey
Utility Valuation Composite vs. S&P 500 Could utilities outperform the S&P 500? Image: MarketDesk Research
Yield Spread (Baa Bonds – Utility Dividends) Chart suggesting that utilities are cheap relative to Baa bonds. Image: Morgan Stanley
Yield Spread (Baa Bonds – Utility Dividends) This interesting chart suggests that utilities are currently cheap. Image: Morgan Stanley Research