U.S. Small-Cap Stocks – Russell 2000 vs. S&P 500
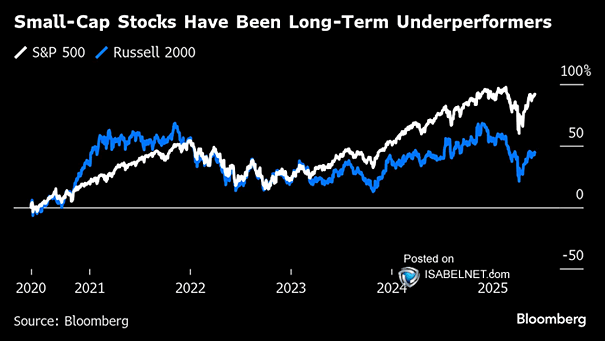
U.S. Small-Cap Stocks – Russell 2000 vs. S&P 500 While U.S. small-cap stocks have notably underperformed large caps for an extended period, history suggests that such cycles are not unusual and are often followed by multi-year stretches of small-cap outperformance. Image: Bloomberg