Valuation – 12-Month Forward P/E Ranges (MSCI Regions)
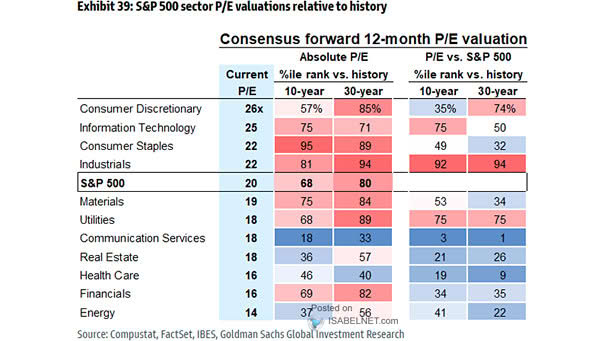
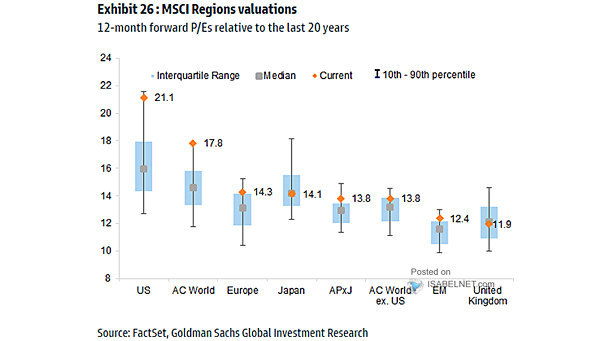
Valuation – 12-Month Forward P/E Ranges (MSCI Regions) U.S. and global equity markets are trading at historically high valuation levels. Sustaining these valuations will require continued—and ideally accelerating—earnings growth across sectors and regions. Image: Goldman Sachs Global Investment Research