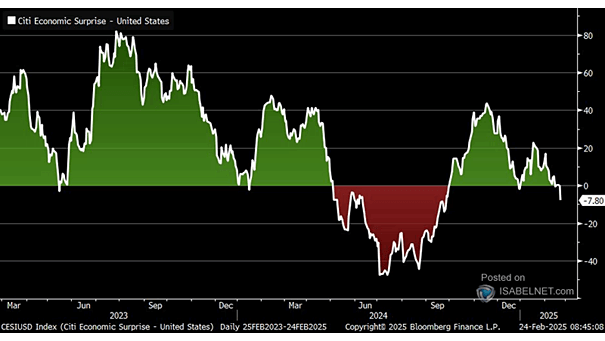
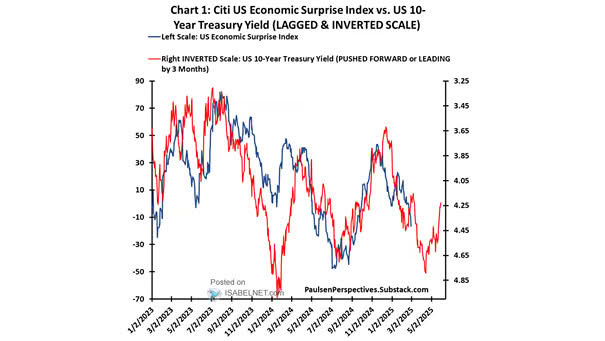
Citi Economic Surprise Index vs. 10-Year U.S. Treasury Yield

Citigroup Economic Surprise Index vs. 10-Year Treasury Yield This chart shows a good correlation between Citigroup Economic Surprise Index and 10-year Treasury yield. Lower yields ahead? You may also like “For the Last Few Years, Equity Markets Have Been Leading Bond Markets.” Image: Yardeni Research, Inc.

Citi Economic Surprise Index

Citi Economic Surprise Index The falling Citi U.S. Economic Surprise Index indicates that economic data is no longer surpassing expectations, but this doesn’t necessarily signal a sudden economic downturn. Image: Bloomberg

S&P 500 Index vs. U.S. Citi Economic Surprise Index

S&P 500 Index vs. U.S. Citi Economic Surprise Index The S&P 500 Index and the U.S. Citi Economic Surprise Index are often closely correlated. But right now, bad news is good news, until it’s not. Image: Morgan Stanley Wealth Management

Citi Economic Surprise Index

Citi Economic Surprise Index The Citi Economic Surprise Index for the U.S. is on the rise, signaling that economic data releases are exceeding analyst expectations and pointing to a positive momentum in the U.S. economic performance. Image: BofA Global Research

Citi Economic Surprise Index and S&P 500

Citi Economic Surprise Index and S&P 500 This chart highlights the current divergence between the Citi Economic Surprise Index and the S&P 500. Image: BofA Global Research

Citi Economic Surprise Index and S&P 500

Citi Economic Surprise Index and S&P 500 The Citi Economic Surprise Index has risen sharply, but it has an inconsistent history in terms of its correlation with the S&P 500. It is a cyclical indicator: high readings suggest favouring defensives over cyclicals, and low readings suggest favouring cyclicals over defensives. Image: Renaissance Macro