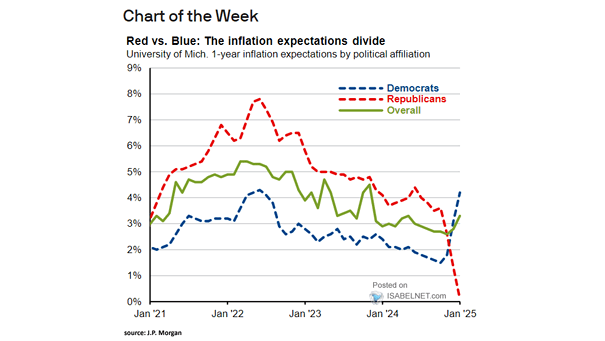
U.S. Core CPI Inflation
U.S. Core CPI Inflation U.S. inflation is moderating, aided by a slowing economy and a weaker labor market. However, the full impact of tariffs is expected to materialize in the coming months, potentially reversing the current disinflationary trend. Image: TS Lombard