Speculative Positions in S&P 500 Futures Contracts
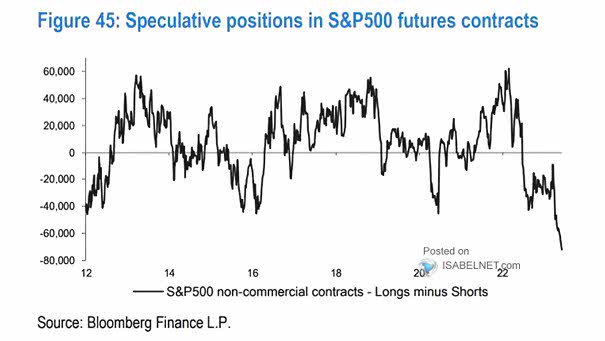
Speculative Positions in S&P 500 Futures Contracts There is still a massive short position building up against the S&P 500. Image: J.P. Morgan
Speculative Positions in S&P 500 Futures Contracts There is still a massive short position building up against the S&P 500. Image: J.P. Morgan
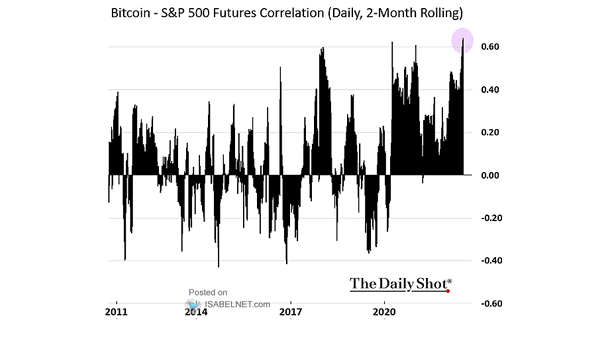
Bitcoin – S&P 500 Futures Correlation Bitcoin’s correlation with S&P 500 futures is growing Image: The Daily Shot

S&P 500 Future Returns After 7 Quarter Win Streak Historically, 7 quarter S&P 500 win streaks tend to be bullish for U.S. stocks. Image: LPL Research
S&P 500 Future Returns After Big Weekly Gains Big weeks (like last week) tend to be bullish for U.S. stocks over the next 3 months Image: LPL Research
S&P 500 Futures and 50-Day Moving Average Morgan Stanley remains bearish on the U.S. stock market for this fall. Image: Morgan Stanley Research
S&P 500 Futures and 50-Day Moving Average Should investors buy the dip on U.S. stocks? Image: The Daily Shot
S&P 500 Future Returns After 7 New Highs in a Row Historically, after seven consecutive new all-time highs, it tends to be bullish for the S&P 500 Index over the next 12 months. Image: LPL Research
CTA Net Position in S&P 500 Futures CTAs have decreased their net long positions in S&P 500 futures. Image: Nomura
CTAs’ Net Position in S&P 500 Futures vs. the ISM PMI CTAs remain net buyers of S&P 500 futures. Image: Nomura
VIX vs. Liquidity (S&P 500 Futures Depth) Should investors expect the market depth to increase, as VIX and liquidity are highly negatively correlated? Image: J.P. Morgan
Cumulative Front Month S&P 500 Futures Returns by Time of Day Gains in S&P 500 futures have occurred after-hours since March lows. Image: Goldman Sachs Global Investment Research