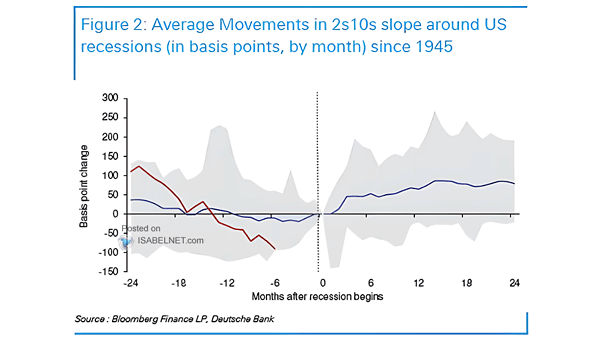
U.S. Recession Probability Based on Front-End Yield Curve Slope
U.S. Recession Probability Based on Front-End Yield Curve Slope The probability of a recession in the United States is still low over the next 12 months. Image: BofA Global Research
U.S. 10Y-2Y Yield Curve Slope Should investors expect a more inverted 10Y-2Y yield curve? Image: Goldman Sachs Global Investment Research
Yield Curve – 2-Year/10-Year U.S. Treasury Slope Will the U.S. Treasury yield curve continue to flatten? Image: BCA Research
U.S. 2s10s Yield Curve Slope and U.S. 10-Year Rates (3-Month Implied Volatility) U.S. 10-year rates volatility is higher with stepper U.S. 2s10s yield curve. Image: Goldman Sachs Global Investment Research
Yield Curve – 2s-10s U.S. Treasury Slope Around the U.S. Election Date in 2016 and 2020 The U.S. Treasury yield curve could steepen following the presidential election. Image: J.P. Morgan
Probability of U.S. Recession in 12 Months Based on the Slope of the Yield Curve The yield curve slope suggests odds of a recession in the next 12 months at less than 30% in the U.S., and the continuation of economic expansion. Image: NBF Economics and Strategy
Distribution of Forward Returns by 200MA Slope This great chart shows the distribution of forward returns when the slope of S&P 500’s 200-day moving average is lower, flat or higher. Image: Ritholtz Wealth Management
3-Month Rate 1-Year Forward vs. 3-Month Leads U.S. GDP This chart suggests that the 1y3m-3m slope leads U.S. GDP. The 1y3m-3m slope has turned down sharply and is informative for year-head growth. Image: BofA Merrill Lynch
U.S. Recession Probabilities Over the Next Year from the Yield Curve Deutsche Bank has calculated the U.S. recession probabilities over the next year, using the slope of various yield curves. PCA (Principal Component Analysis) is used to estimate the effects of yield curve movements. Image: Deutsche Bank
Heavy Truck Sales as Recession Indicator Historically, before recessions, heavy truck sales tend to peak (red arrow) and then decline (black arrow). Currently, heavy truck sales have a nice upward slope and show no sign of peaking. So, it suggests that there is no imminent recession on the horizon. You may also like “U.S. Heavy…