Global Earnings Revision Ratio
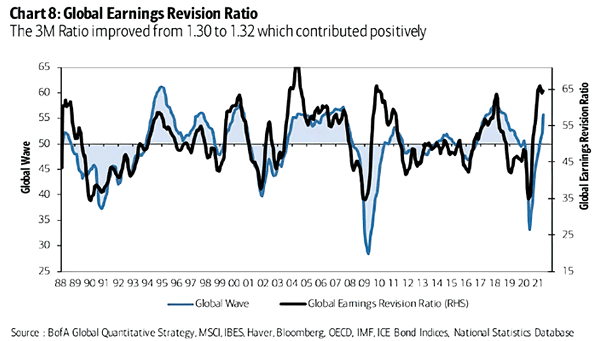
Global Earnings Revision Ratio The global earnings revision ratio is still improving. Image: BofA Global Quantitative Strategy
Global Earnings Revision Ratio The global earnings revision ratio is still improving. Image: BofA Global Quantitative Strategy
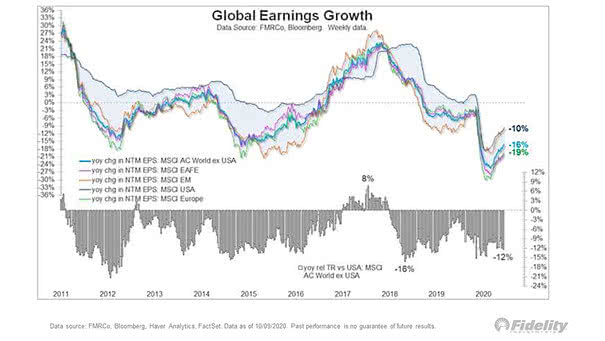
Global EPS – Global Earnings Growth This chart highlights the strong recovery in global earnings growth. Image: Fidelity Investments

Global Earnings Growth Chart showing that the gap between U.S. earnings growth and non-U.S. earnings growth is narrowing. Image: Fidelity Investments
Semiconductor Sales vs. Global Earnings per Share The chart shows that semiconductor sales suggest a collapse in corporate earnings. Image: Jeroen Blokland
Global Earnings since 2006 This chart shows global earnings since 2006 (USA, Emerging Markets, Japan and Europe). As Warren Buffett said: “for 240 years, it’s been a terrible mistake to bet against America.” This chart below illustrates it well since 2006. You may also like “Earnings Matter, Over the Long Run.” Source: J.P. Morgan Asset Management
Earnings – Global Manufacturing PMI New Orders vs. World Trailing 12-Month EPS (Leading Indicator) Global manufacturing PMI new orders tend to lead world EPS growth by 12 months. Image: BofA Global Research
Global Nonfinancial Equities – Earnings-Per-Share Growth and Capex Growth A recovery in global capex growth is expected in 2021. Image: Morgan Stanley Wealth Management
Global Manufacturing PMI Leads Earnings The chart suggests that Global Manufacturing PMI leads earnings by 9 months. Image: Charles Schwab
Earnings Sentiment (Analyst Upgrades Minus Downgrades Across Markets) Earnings sentiment for the S&P 500 has improved, with several key indicators pointing to robust corporate performance and potential for continued market growth. Image: Goldman Sachs Global Investment Research
Share of Global Market Capitalization The United States’ 64% global equity market share stems from strong corporate earnings, technological innovation, deep capital markets, and global revenue exposure, driving its dominant influence on global finance. Image: Goldman Sachs Global Investment Research
Cumulative Change in Consensus Earnings Estimates Despite a projected slowdown in earnings growth for the Magnificent 7 in 2025, analysts remain broadly optimistic about their continued market leadership. Image: Goldman Sachs Global Investment Research