Number of 2% Drops per Year for the S&P 500 Index

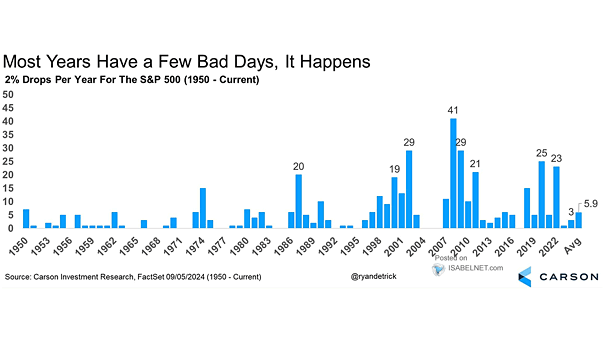
Number of 2% Drops per Year for the S&P 500 Index Though they can be uncomfortable, big drops in the U.S. stock market are relatively common, even in the best years. On average, the S&P 500 sees more than five drops of 2% or more each year. Image: Carson Investment Research

S&P 500 Adds and Drops

S&P 500 Adds and Drops The turnover in the S&P 500 is relatively high, with an average rate of about 4% per year. Image: S&P Dow Jones Indices

Largest VIX 4-Day Drops Ever

Largest VIX 4-Day Drops Ever Large drops in the VIX tend to push the S&P 500 higher. Image: LPL Research

15 Largest Dow Jones Point Drops

15 Largest Dow Jones Point Drops Going back to 1896, yesterday was the 380th largest percentage drop ever for the Dow Jones. Image: LPL Research

Largest 1-Day Drops for the S&P 500 per Year

Largest 1-Day Drops for the S&P 500 per Year Yesterday, the S&P 500 fell by almost 3%. The average largest 1-day drop per year is -4.04% since 1928. Image: LPL Research

Consumer Sentiment Index and Subsequent 12-Month S&P 500 Returns

Consumer Sentiment Index and Subsequent 12-Month S&P 500 Returns Historically, sharp drops in consumer sentiment have often preceded strong stock market performance over the following year, making sentiment lows a potential signal for future gains. Image: J.P. Morgan Asset Management

Sentiment – GS Business Optimism Tracker

Sentiment – GS Business Optimism Tracker U.S. business optimism has seen a significant and widespread decline in early 2025, as multiple indicators and surveys report sharp drops in sentiment among CEOs, CFOs, and small business owners. Image: Goldman Sachs Global Investment Research