MSCI AC World Calendar Year Returns vs. Intra-Year Declines
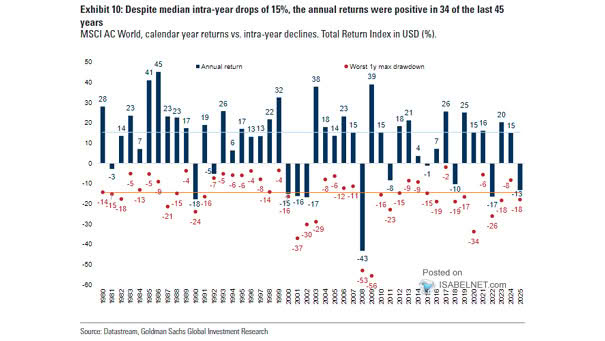
MSCI AC World Calendar Year Returns vs. Intra-Year Declines Despite median intra-year drops of 15%, the global equity index ended positively in 34 of the past 45 years—highlighting the value of long-term investing over reacting to short-term volatility. Image: Goldman Sachs Global Investment Research