10-Year Treasury Non-Commercial Net Positioning and Market Yield on U.S. Treasury at 10-Year Constant Maturity
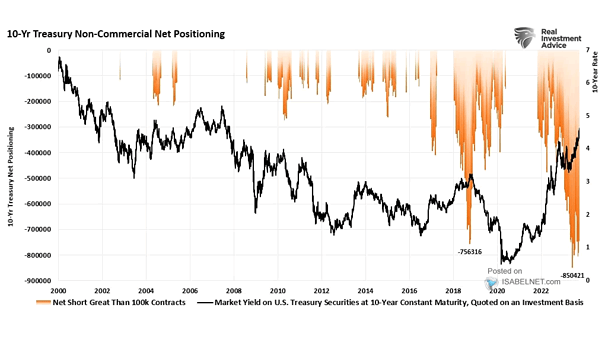
10-Year Treasury Non-Commercial Net Positioning and Market Yield on U.S. Treasury at 10-Year Constant Maturity Given the high level of short positions in 10-year U.S. Treasuries, some investors may find it advantageous to increase the duration of their bond portfolio in a scenario of falling interest rates. Image: Real Investment Advice