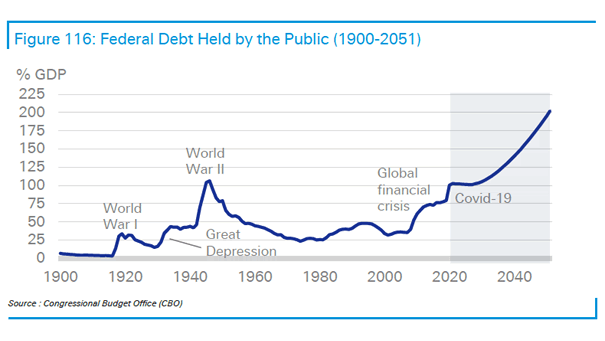
GWIM Debt Holdings as % of AUM

GWIM Debt Holdings as % of AUM BofA’s private clients maintain a low debt allocation of 20%, remaining below the average level. Image: BofA Global Investment Strategy

Margin Debt Expansion vs. Contraction

Margin Debt Expansion vs. Contraction Margin debt continues to rise, remaining below extreme levels. This reflects the optimism among market participants and has the potential to drive further upward momentum in U.S. stock prices. Image: Topdown Charts

Global Debt Hits a Fresh Record

Global Debt Hits a Fresh Record Reaching an all-time high of $315,000 billion, global debt highlights the challenges and potential risks associated with managing and servicing debt in both developed and developing economies. Image: International Monetary Fund

S&P 500 vs. Margin Debt

S&P 500 vs. Margin Debt Margin debt boosts market gains as investors leverage to increase buying power. The recent rise in margin debt confirms exuberance and raises worries of a market correction. Image: Real Investment Advice

EM Debt Flows

EM Debt Flows Outflows from emerging market debt persist, indicating a sustained trend of movement away from this financial asset. Image: BofA Global Investment Strategy

U.S. National Debt

U.S. National Debt The U.S. national debt has surpassed a staggering $34 trillion, and the trajectory of this ever-increasing debt raises concerns about long-term economic sustainability. Image: BofA Global Investment Strategy

Global Government Debt

Global Government Debt Global government debt has skyrocketed since the global financial crisis, reaching its highest level in peacetime and posing significant challenges and vulnerabilities for governments and economies worldwide. Image: BofA Global Investment Strategy

World Debt

World Debt Is world’s debt flying to the moon? Image: BofA Global Investment Strategy

GWIM Flows to Debt

GWIM Flows to Debt The significant rate at which BofA’s private clients are selling debt may reflect a change in investment strategy. Image: BofA Global Investment Strategy

S&P 500 – Margin Debt vs. Long-Term Trend

S&P 500 – Margin Debt vs. Long-Term Trend A rise in the ratio of margin debt to the S&P 500 market cap could indicate a bullish outlook for the U.S. stock market, potentially signaling confidence in the market’s upward trajectory. Image: Topdown Charts