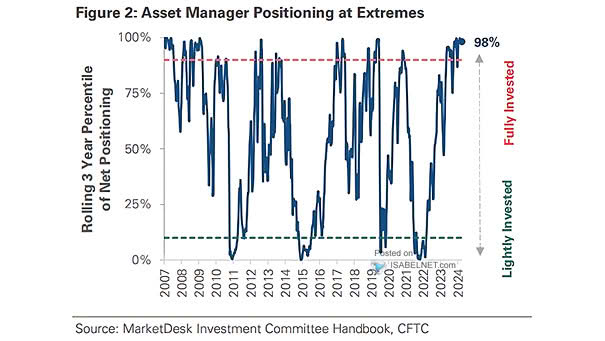
U.S. Equity Mutual Funds – Cash and Liquid Assets
U.S. Equity Mutual Funds – Cash and Liquid Assets Cash holdings of mutual funds are going down. Image: Goldman Sachs Global Investment Research
GWIM Equity Allocation as % Assets Under Management Equity allocation from BofA’s private clients stands at 59%. Image: BofA
Cumulative Fund Flows Across Assets Money market funds remain a popular investment option, as investors continue to allocate their funds into them. Image: Goldman Sachs Global Investment Research
GWIM Cash Allocation as % Asset Under Management Cash allocation from BofA’s private clients is still below the long-term average. Image: BofA
Equity – U.S. Households Aggregate Financial Asset Allocation U.S. households currently allocate 41% of their total financial assets to equities, which is elevated. Image: Goldman Sachs Global Investment Research
History of Asset Bubbles Past 40-Years The hype around artificial intelligence (AI) could lead to a valuation bubble, where companies and investors place unrealistic expectations on the technology and its capabilities. Image: BofA Global Investment Strategy
Money Market Fund Assets The prior two surges in U.S. money market fund assets, in 2008 and 2020, the Fed cut interest rates. Image: BofA Global Investment Strategy
Total Assets of Failed Institutions as % of GDP What will be the impact of bank failures on the U.S. economy? Image: Deutsche Bank
Risky vs. Safe Assets Fund Flows Risky vs. safe assets fund flows remain very negative, which is contrarian bullish for equities. Image: Goldman Sachs Global Investment Research
Money Market Fund Assets as a Percent of S&P 500 Market Capitalization Cash on the sidelines is not elevated relative to the S&P 500 market capitalization. Image: Morgan Stanley Wealth Management