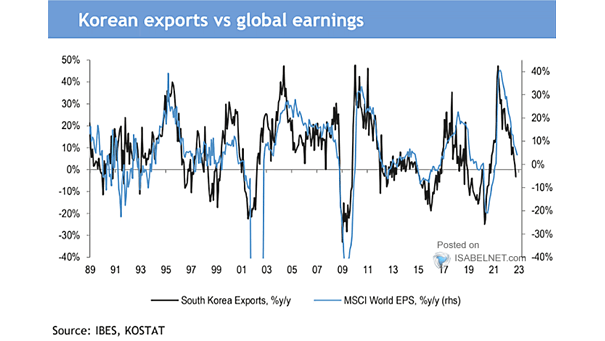
South Korea Exports vs. MSCI World EPS
South Korea Exports vs. MSCI World EPS South Korea’s exports tend to lead global earnings. Image: J.P. Morgan
South Korea Exports vs. MSCI World EPS South Korea’s exports tend to lead global earnings. Image: J.P. Morgan
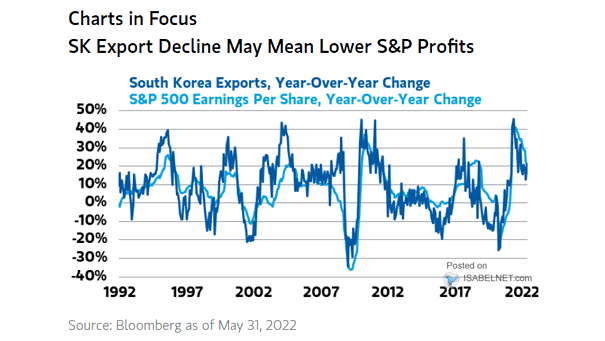
EPS – South Korea Exports vs. S&P 500 Earnings per Share Should investors expect a decline in S&P 500 profits going forward? Image: Morgan Stanley Wealth Management

S&P 500 vs. Korean KOSPI Is the current divergence between the Korean KOSPI and the S&P 500 a red flag? Image: Lohman Econometrics
Global EPS Growth and South Korean Exports Chart suggesting that growth in South Korean exports can help forecast global EPS growth over the next 12 months. Image: BofA Global Investment Strategy
Taiwan’s Tech Exports vs. South Korea The Taiwan’s tech sector has trumped its South Korean peer since 2018. Image: Gavekal, Macrobond
New Coronavirus Cases in Italy and South Korea These charts suggests that new coronavirus cases in Italy and South Korea are still tracking China’s outbreak. Image: Charles Schwab
Number of New Coronavirus Cases, Ex-Mainland China, South Korea, Italy and Iran Chart suggesting that the growth of new coronavirus cases, ex-Mainland China, South Korea, Italy and Iran aren’t accelerating. Image: Pantheon Macro
Global Profit Cycle – South Korea Exports and Global EPS Chart showing the correlation between South Korea exports and global EPS. Image: BofA Global Investment Strategy
MSCI World EPS and South Korea Exports Chart showing the quite good correlation between MSCI World EPS and South Korea exports, and suggesting this does not bode well for MSCI World EPS. Image: Nordea and Macrobond
S&P 500 EPS and South Korea Exports Chart showing the quite good correlation between S&P 500 EPS and South Korea exports, and suggesting this does not bode well for S&P 500 EPS. Image: Nordea and Macrobond