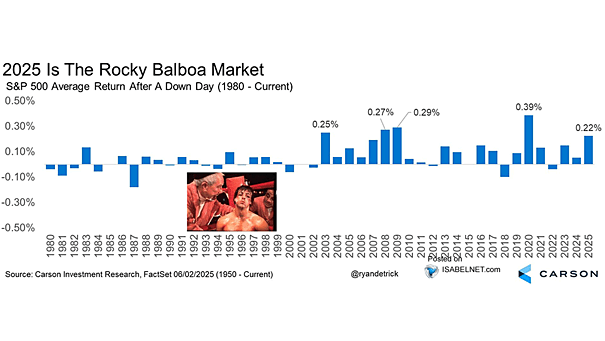
S&P 500 Index 3-Day Average Returns

S&P 500 Index 3-Day Average Returns Are U.S. equity investors ready for a Santa Claus rally this year? Image: LPL Research Click the Image to Enlarge  

S&P 500 Index Single Day Average Returns

S&P 500 Index Single Day Average Returns Historically, the last week of October and the first week of November tend to be bullish for U.S. stocks. Image: LPL Research

Average Return Following a Peak in ISM Manufacturing

Average Return Following a Peak in ISM Manufacturing After a peak in ISM manufacturing, the forward return on the S&P 500 tends to be negative on average over the next 3 months. Image: Goldman Sachs Global Investment Research

S&P 500 Average Returns Since 1926

S&P 500 Average Returns Since 1926 Historically, in the year following a double-digit gain, there have only been three years where the U.S. stock market has experienced a double-digit decline. Image: Ben Carlson

S&P 500 Average Return for Each Day

S&P 500 Average Return for Each Day This spreadsheet shows the S&P 500 average return for each day from 1950 to 2018. “History never repeats itself but it rhymes” –Mark Twain. October 28 has been historically the best day of the year for the S&P 500. You may also like “S&P 500 vs. Its Seasonal Pattern.” Image: Ryan…