Index of Leading Indicators vs. Industrial Production
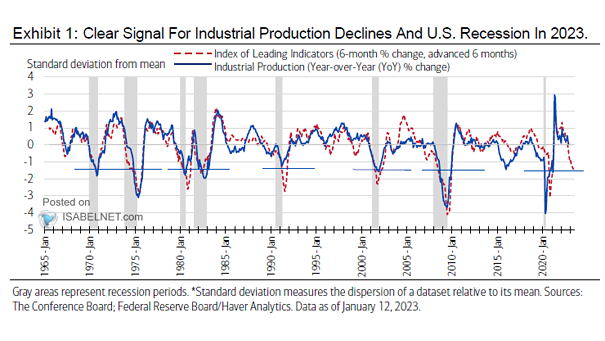
Index of Leading Indicators vs. Industrial Production A further deterioration in U.S. industrial production seems very likely. Image: Merrill Lynch Wealth Management
Index of Leading Indicators vs. Industrial Production A further deterioration in U.S. industrial production seems very likely. Image: Merrill Lynch Wealth Management
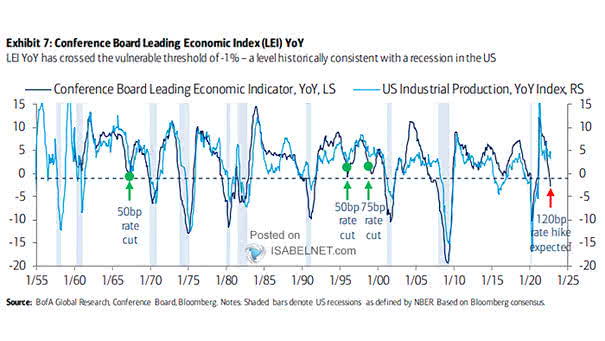
Recession – Conference Board Leading Economic Index vs. U.S. Industrial Production The Conference Board Leading Economic Index suggests a contraction in U.S. industrial production. Image: BofA Global Research

China Real GDP and Industrial Production China is experiencing a strong V-shaped economic recovery from the coronavirus pandemic. Image: BofA Global Investment Strategy
M3 Money Supply Relative to Nominal Industrial Production at Recession End Dates This chart shows the surge in the money supply at record level. Image: Stifel
China Real M1 Leads World Industrial Production Chart suggesting that China’s real M1 leads world industrial production by 6 months. Image: Nordea, Sebastian Dypbukt Källman
S&P 500 Value vs. Growth Leads Global Industrial Production This great chart suggests that the S&P 500 value vs. growth leads global industrial production by 9 months. Image: Alpine Macro
U.S. Industrial Production and GDP This chart clearly shows the divergence between U.S. industrial production and GDP, since the financial crisis. Image: Gavekal, Macrobond
U.S. Industrial Production YoY by Segment since 2013 Another excellent chart showing the U.S. industrial production by segment. Image: Pervalle Global
Smoothed U.S. Recession Probabilities The probability of U.S. recession stands at 0.48%. When this recession indicator exceeds 5% (red line), history suggests that the probability of recession increases significantly. The chart shows the smoothed U.S. recession probabilities indicator on a log scale. Smoothed U.S. recession probabilities are obtained from a dynamic-factor markov-switching model applied to…
ANZ Global Lead Index The ANZ Global Lead Index is a leading indicator on global industrial production. The chart shows that growth momentum peaked in 2018. Currently, global growth is actually starting to moderate seriously. Image: ANZ Research
How’s the U.S. Economy Doing Now? The real GDP Nowcast relies on soft data such as consumer and business surveys and hard data such as retail sales and industrial production. It forecasts the growth of real GDP. At full employment, GDP returns to the level of potential GDP. If a recession were to occur today,…