Announced Buybacks on Wilshire 5000

Announced Buybacks on Wilshire 5000 This year, announced buybacks are heading past $2 trillion, a new record. But there is a gap between what companies say and what they actually do. In practice, actual buybacks lag far behind the promises. Image: Bloomberg

Tech: Capex and Buyback & Dividends

Tech: Capex and Buyback & Dividends Tech capex has now overtaken buybacks and dividends. Are shareholders trading short-term pain for long-term gain? It only works if that spending delivers real returns. Image: Societe Generale Cross Asset Research

Hyperscaler Capex, EBITDA and Net Buybacks

Hyperscaler Capex, EBITDA and Net Buybacks Hyperscaler capex is outpacing earnings and starting to bite. Buybacks are slipping as cash is redirected into AI infrastructure, setting up a tradeoff: more upside later, less cash in shareholders’ pockets today. Image: Deutsche Bank Asset Allocation

Global Share Buyback Announcements

Global Share Buyback Announcements Global share buybacks show no signs of slowing, as steady earnings keep the pipeline full. For shareholders, that’s a supportive backdrop, and unless profits falter, the momentum looks durable. Image: J.P. Morgan Flows & Liquidity

U.S. Share Buyback Authorization Announcements

U.S. Share Buyback Authorization Announcements Buybacks are fueling the rally on Wall Street, with U.S. authorizations exceeding a record $860 billion since the start of the year and reinforcing a strong floor for equities. Image: Goldman Sachs Global Investment Research

S&P 500 Weekly Announced Buybacks

S&P 500 Weekly Announced Buybacks Buyback announcements are picking up across corporate America, pointing to healthy balance sheets and a greater appetite to spend surplus cash. That wave is supporting equities and keeping sentiment constructive. Image: Deutsche Bank Asset Allocation

U.S. Tech Sector Share Buyback Announcements

U.S. Tech Sector Share Buyback Announcements There’s no sign of a pause in U.S. tech buybacks, as strong earnings keep the pipeline active. That’s a tailwind for shareholders, and as long as profits hold up, the pace is unlikely to fade. Image: J.P. Morgan Flows and Liquidity

S&P 500 Buybacks vs. S&P 500 Composite 12-Month Trailing EPS

S&P 500 Buybacks vs. S&P 500 Composite 12-Month Trailing EPS Corporate buybacks and earnings growth have risen hand in hand. Much of that growth, though, reflects companies lifting their own share prices. With valuations stretched, investors should ask what they’re really paying for. Image: Real Investment Advice

S&P 500 Buybacks

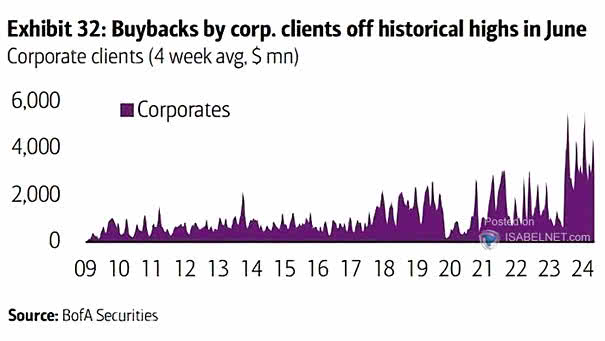
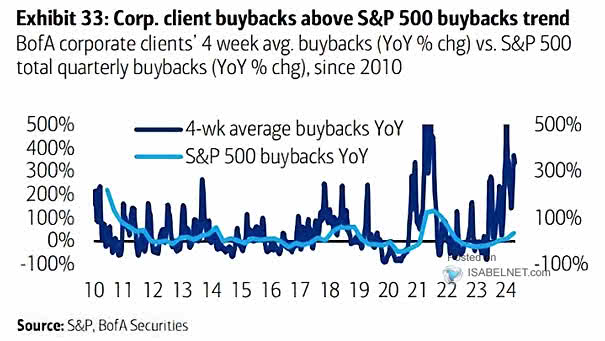
S&P 500 Buybacks S&P 500 buybacks have lost some steam lately, but most analysts view it as a short breather following record highs, not a sign that corporate cash is drying up. Image: Deutsche Bank Asset Allocation

U.S. Share Buyback Announcements

U.S. Share Buyback Announcements Bulls are right to smile: At $6–7 billion a day through year-end, U.S. corporate buybacks are the market’s invisible hand—lifting prices and muting every attempt at a selloff. Image: Goldman Sachs Global Investment Research

Buyback Aristocrats vs. Dividend Aristocrats

Buyback Aristocrats vs. Dividend Aristocrats Fueled by growth momentum and turbo‑charged buybacks, Buyback Aristocrats have left Dividend Aristocrats in the dust, as investors chase upside over income stability. Image: Goldman Sachs Global Investment Research