Economic Growth vs. M2 Velocity
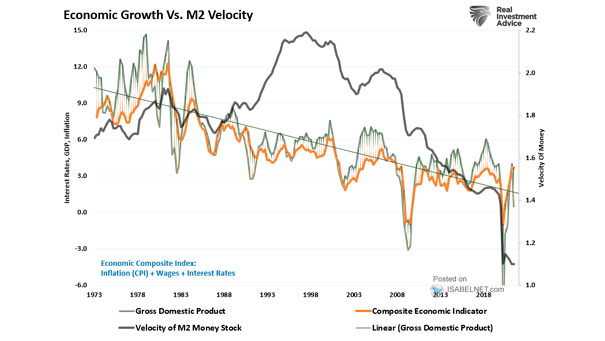
Economic Growth vs. M2 Velocity The decline in economic growth has coincided with a collapse in M2 velocity Image: Real Investment Advice
Economic Growth vs. M2 Velocity The decline in economic growth has coincided with a collapse in M2 velocity Image: Real Investment Advice
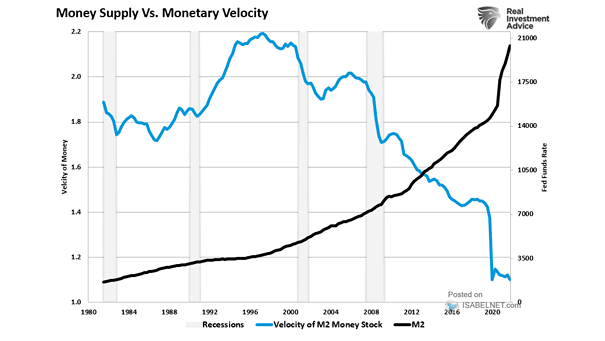
M2 – Money Supply vs. Monetary Velocity Is printing more money good for the U.S. economy? Despite strong M2 growth, money velocity has declined. Image: Real Investment Advice

Velocity of M2 Money Stock in the U.S. vs. The U.S. Deficit The rise in the U.S. deficit has coincided with a collapse in M2 velocity. Image: Real Investment Advice
Velocity of M2 Money Stock in the U.S. Is there really an inflation threat? The surge in M2 money growth has coincided with a collapse in M2 velocity. Image: The Daily Shot
Total Debt vs. U.S. GDP vs. Monetary Velocity The rise in debt has coincided with a collapse in M2 velocity. Image: Real Investment Advice
Valuation – S&P 500 Market Capitalization to GDP vs. S&P 500 Market Capitalization to M2 This chart puts market valuations into perspective, as the massive collapse in the velocity of money has led the Fed to print money. Image: Nordea and Macrobond
U.S. Core Inflation Expected Over the Next 21 Months (Leading Indicator) M2 velocity year-over-year tends to lead U.S. core CPI by 21 months (R² = 0.52 since 1996). It has been quite accurate for more than 20 years. Click the Image to Enlarge