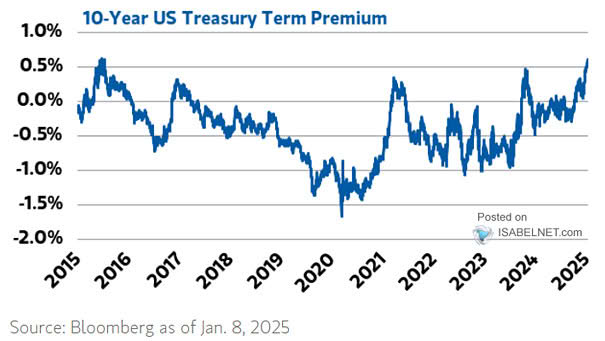
U.S. 10-Year Treasury Term Premium
U.S. 10-Year Treasury Term Premium Will the U.S. 10-year Treasury term premium continue to rise? Image: BofA Global Research
U.S. 10-Year Treasury Term Premium Will the U.S. 10-year Treasury term premium continue to rise? Image: BofA Global Research
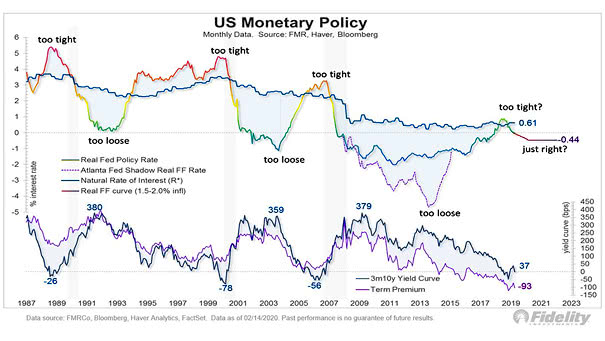
U.S. Monetary Policy, Term Premium and Yield Curve This chart suggests when U.S. monetary policy is too tight or too loose. An inverted yield curve is a sign that monetary policy is too tight. Image: Fidelity Investments

Demographics – Labor Force Growth and Term Premium Chart suggesting that growth in the labor force could explain the term premium. The term premium is the risk premium (or the bonus) that investors receive for the risk of owning longer-term bonds. Image: Fidelity Investments
MOVE vs. Treasury Term Premium This chart shows the nice correlation between MOVE (implied volatility of U.S. Treasury markets) and the Treasury term premium. The term premium is the risk premium (or the bonus) that investors receive for the risk of owning longer-term bonds. Image: Longview Economics, Macrobond
Term Premium on a 10-Year Zero Coupon Bond Term premium on a 10-year zero coupon bond remains in negative territory. Investors do not seem to fear rising rates over the long-term. The term premium is the risk premium (or the bonus) that investors receive for the risk of owning longer-term bonds.
U.S. Equity Risk Premium – Long-Term View Should investors approach U.S. equities with caution due to the significant decline in the equity risk premium, which stands well below its historical average? Image: Topdown Charts
S&P 500 Equity Risk Premium and Long-Term Average The S&P 500 equity risk premium is slightly higher than the long-term average of 280 bps, but well below the 436 bps average since the Great Financial Crisis. Image: Morgan Stanley Wealth Management
Valuation – FY2 P/E Premium of Growth vs. Value The valuation spread between Growth and Value is still well above its long-term average. Image: Goldman Sachs Global Investment Research
U.S. Equity Risk Premium and VIX The U.S. equity risk premium remains above its long-term average, but the risk-adjusted return of equity has dropped below its long-term avearge this year. Image: Societe Generale Cross Asset Research/Global Asset Allocation
Valuation – 12-Month Forward P/E and Equity Risk Premium Despite the rise in the forward 12-month P/E ratio, the equity risk premium is in line with its long-term average. Image: Fidelity Investments