U.S. 10Y-3M Yield Curve
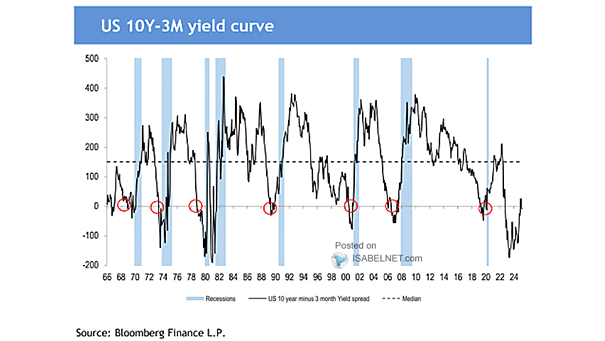
U.S. 10Y-3M Yield Curve While a steepening inverted yield curve has historically served as a warning sign for U.S. recessions, its predictive power may be less definitive in this cycle. Image: J.P. Morgan
U.S. 10Y-3M Yield Curve While a steepening inverted yield curve has historically served as a warning sign for U.S. recessions, its predictive power may be less definitive in this cycle. Image: J.P. Morgan
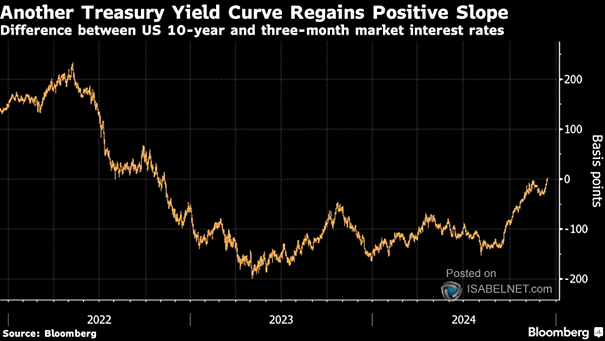
U.S. 10Y-3M Yield Curve For the first time since 2022, yields on U.S. 10-year Treasury notes have surpassed those of three-month bills, indicating a potentially positive outlook for U.S. stocks, particularly when a recession is avoided. Image: Bloomberg

The 10Y-3M Yield Curve Although the U.S. 10Y-3M yield curve is not on the verge of uninverting, historical data suggests that the “uninversion” of the yield curve has been a reliable indicator of an impending recession. Image: Bianco Research
Consecutive Trading Days of Inverted 10Y-3M U.S. Treasury Yield Curve The inversion of the 10Y-3M UST yield curve typically reflects market expectations of slower economic growth and potentially lower interest rates in the future. Image: Morgan Stanley Wealth Management
U.S. Dollar Index vs. 10Y-3M Real U.S. Treasury Yield Curve (Leading Indicator) The real U.S. yield curve suggests that the U.S. dollar may weaken over the next 12 months. Image: Morgan Stanley Wealth Management
U.S. Dollar Index vs. 10Y-3M Real U.S. Yield Curve The 10Y-3M real U.S. yield curve suggests a weaker U.S. dollar over the next 12 months. Image: Bloomberg
U.S. 10Y-3M Yield Curve The U.S. 10Y-3M yield curve suggests that the U.S. economy may be headed for a downturn in the near future. Image: Morgan Stanley Research
U.S. 10Y-3M Yield Curve and Fed Funds Target Rate Historically, the Fed doesn’t pivot policy until a recession arrives and the 10Y-3M US Treasury yield curve inverts. Is it really different this time? Image: Morgan Stanley Wealth Management
U.S. Recessions and 10Y-3M Yield Curve Inverted The odds of a U.S. recession are rising, but remain well below warning levels. Image: Gavekal, Macrobond
Performance – S&P 500 Banks vs. 10Y-3M U.S. Treasury Yield Curve U.S. banks have lagged the broad market over the last 12 months, despite the yield curve steepening. Image: Gavekal, Macrobond
FMS Investors and 10Y-3M Yield Curve FMS investors are expecting a steeper yield curve. At 73%, this is an all-time high. Image: BofA Global Fund Manager Survey