FMS Investors and 10Y-3M Yield Curve

FMS Investors and 10Y-3M Yield Curve FMS investors are expecting a steeper yield curve. At 73%, this is an all-time high. Image: BofA Global Fund Manager Survey

U.S. Corporate Profits and 10Y-3M Yield Curve

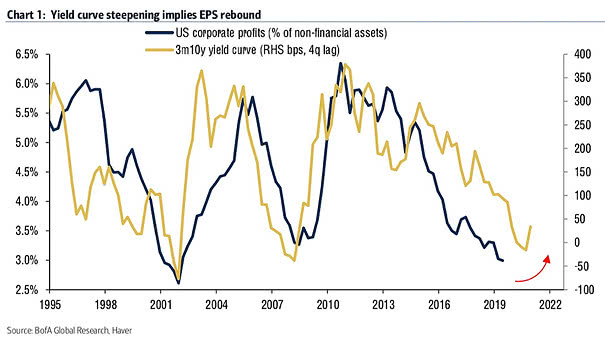
U.S. Corporate Profits and 10Y-3M Yield Curve While the divergence between large-cap profits and the rest of the economy is the widest on record, the steepening yield curve suggests an earnings rebound. Image: BofA Global Research
10Y-3M Yield Curve Inversion and S&P 500 Operating EPS

10Y-3M Yield Curve Inversion and S&P 500 Operating EPS The inversion of the yield curve between 3-month and 10-year Treasurys is not good news for S&P 500 operating EPS  (90D means 3-month T-bill). The 50 day moving average removes false signals since 1967. Image: Stifel

10Y-3M Treasury Yield Spread Adjusted for QE and QT

10Y-3M Treasury Yield Spread Adjusted for QE and QT Adjusted for quantitative easing (QE) and quantitative tightening (QT), the 10-year minus 3-month yield curve may have inverted in December 2018. Image: Morgan Stanley Wealth Management

“Yield Curve” Google Trends vs. 10Y-3M Yield Spread

“Yield Curve” Google Trends vs. 10Y-3M Yield Spread This interesting chart shows the Google trends interest for the “yield curve” compared to the U.S. 10-year minus 3-month Treasury yield spread. If history helps us predict the future, the next market peak could be in 2021 or later, maybe. Image: Ken Fisher