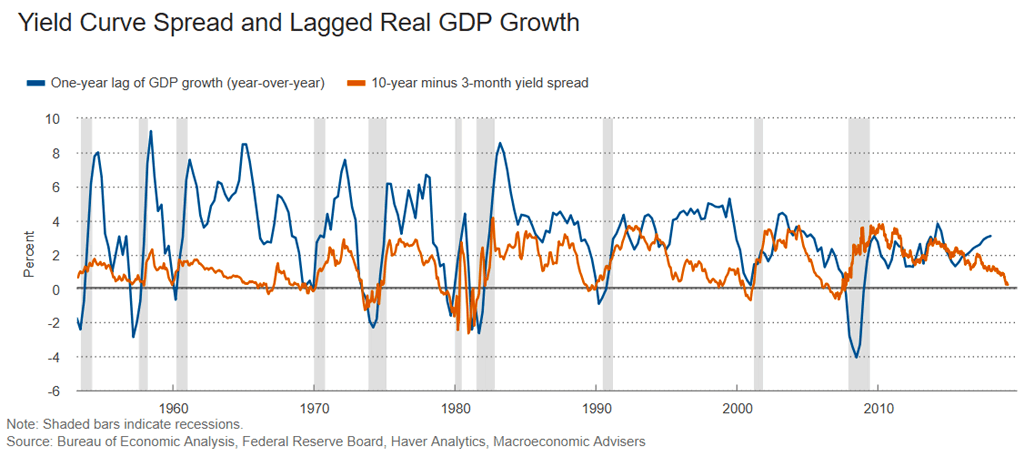
Oct 07 2019 Off 10Y-3M Yield Curve Spread Leads U.S. Real GDP Growth This chart suggests that the 10Y-3M yield spread leads U.S. real GDP growth by one year. So, what about real GDP growth in 2020?