S&P 500 and U.S. IPO Activity
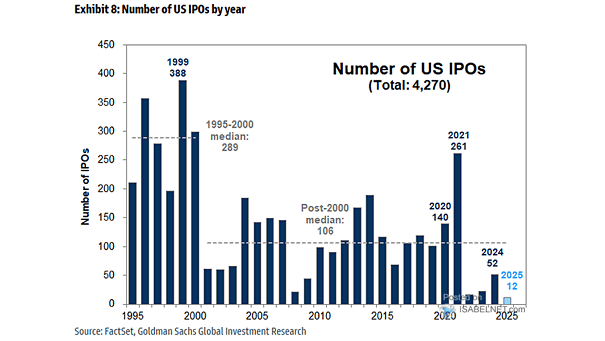
S&P 500 and U.S. IPO Activity Bye-bye U.S. IPOs? IPO activity in the United States remains anemic. Image: Topdown Charts
U.S. IPOs (Excluding SPACs) – Deal Count and Deal Value U.S. IPO activity is on the rise. Image: BofA Global Research
Equity Issuance – IPOs and Secondaries New equity offerings are booming. Are they in a bubble? Image: Fidelity Investments
SPAC IPOs by Week Despite regulatory pressure, SPAC issuance has accelerated. Image: Goldman Sachs Global Investment Research
Performance – U.S. IPOs and S&P 500 Could the poor performance of U.S. IPOs this year have a negative impact on upcoming listings? Image: Financial Times
Valuation – IPOs with Negative Earnings Per Share and Price/Earnings Ratio Is the U.S. stock market facing a dotcom bubble 2.0? Image: Morgan Stanley Wealth Management
SPACs and IPOs SPACs and IPOs are down year-to-date, but are they out? Image: Morgan Stanley Wealth Management
Performance – Non-Profitable Tech, Liquid IPOs and Bitcoin Sensitive Stocks Speculative parts of the market are taking big hits. Image: Financial Times
IPO Activity and Market Cycle IPO activity tends to be slow in the early phases of a new bull market, but that’s not the case today. Image: Richardson Wealth
SPAC IPO Volume – U.S. SPAC Capital Raised So far, only 6 new SPAC IPOs have come to market in Q2 this year, as the SEC is stepping up scrutiny of SPAC companies. Image: Goldman Sachs Global Investment Research