World Epidemics and Global Stock Market Performance
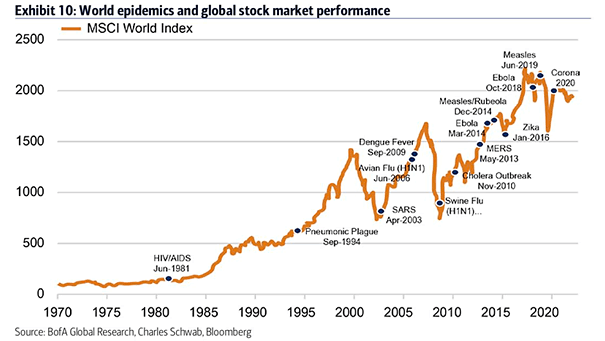
World Epidemics and Global Stock Market Performance This chart shows how the global stock market has performed during past world epidemics. Image: BofA Global Research
World Epidemics and Global Stock Market Performance This chart shows how the global stock market has performed during past world epidemics. Image: BofA Global Research
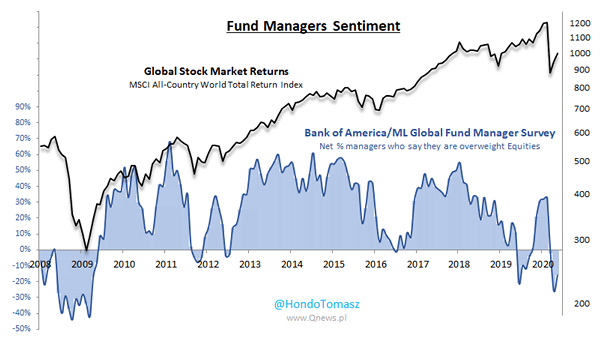
Fund Managers Sentiment and Global Stock Market Returns (MSCI ACWI) Are fund managers too bearish? Two-thirds of global fund managers say this is a bear market rally. Image: Hondo Tomasz

Global Stock Markets Total Returns in 2019 Chart showing how major global stock markets performed in 2019. Image: Fidelity Investments
World Epidemics and Global Stock Market Performance Chart showing that the impact of past world pandemics has not been significant on the global stock market. Image: Charles Schwab
U.S. Stock Market as a % of Global U.S. stocks dominate global equity markets. Image: BCA Research
Major Central Bank Balance Sheets vs. Total Value of Global Stock and Bond Markets Are central banks creating bubbles? Image: Lohman Econometrics
Market Capitalization – United States vs. Asia vs. Europe The U.S. market outperformed global markets over the past decade due to strong earnings, profitability, and capital dynamics, but sustaining this may be challenging given high valuations and other factors. Image: Goldman Sachs Global Investment Research
Market Breadth – Percent Below 52-Week High S&P 500 Index Less Median Stock In recent months, the S&P 500’s 52-week market breadth has shown signs of deterioration. Is an improvement possible before the end of the year? Image: Goldman Sachs Global Investment Research
Equity Market Concentration – Market Capitalization of 10 Largest Companies as Share of S&P 500 Total The S&P 500’s top 10 stocks hold a disproportionately large share of the index’s weight relative to their earnings, which amplifies risks tied to volatility, diversification, and sector exposure. Image: Goldman Sachs Global Investment Research
Global Market Implied Equity Risk Premiums The low U.S. equity risk premium reflects a market where investors earn little to no additional expected return for taking on the higher risk of stocks compared to bonds. As a result, equity investing becomes more challenging. Image: Goldman Sachs Global Investment Research
Concentration – Top 10, Top 3 and Top 1 as % of Total (In Terms of Total Equity Market Capitalization) China has one of the lowest market capitalization concentrations worldwide, with its top ten companies comprising only 17% of total market cap—much less than the US’s 34%—indicating greater growth potential in China. Image: Goldman Sachs…