Percentage of S&P 500 Stocks Above 200-Day Moving Average

Percentage of S&P 500 Stocks Above 200-Day Moving Average The percentage of S&P 500 stocks above their 200-day moving average is showing signs of a bearish divergence, which can be an early warning signal of a potential market correction. Image: BofA Global Research

Market – Breadth Index

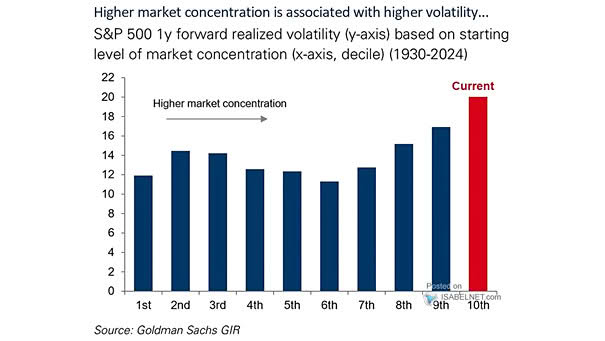
Market – Breadth Index The market’s performance is disproportionately driven by a small number of U.S. stocks, as evidenced by the low Goldman Sachs Breadth Index, rather than reflecting a widespread rally across the market. Image: Goldman Sachs Global Investment Research
S&P 500 Realized 3-Month Single Stock Correlation

S&P 500 Realized 3-Month Single Stock Correlation The current low correlation regime is reminiscent of the dot-com bubble and could persist for some time, but history suggests it will likely reverse when the market experiences its next downturn. Image: BofA Global Research

Ownership Breakdown of the U.S. Equity Market

Ownership Breakdown of the U.S. Equity Market (Share of Corporate Equity Market) U.S. households hold the largest share of the equity market, reflecting confidence in stocks. However, ownership is very concentrated, with the wealthiest 10% owning about 93% of all U.S. stocks held by households. Image: Goldman Sachs Global Investment Research
Market – Geographical Breakdown of MSCI World Index Constituents

Market – Geographical Breakdown of MSCI World Index Constituents The combined market capitalization of the Magnificent Seven would make it the second-largest country stock exchange globally. This would surpass the total value of many thriving economies. Image: BofA Global Research

Median S&P 500 Stock Short Interest as % of Market Capitalization

Median S&P 500 Stock Short Interest as % of Market Capitalization The S&P 500’s median short interest level remains low at 1.8%, suggesting that market participants are generally optimistic, or at least, not strongly bearish about the future performance of the S&P 500. Image: Goldman Sachs Global Investment Research

Valuation – U.S. Equity Market Capitalization to GDP

Valuation – U.S. Equity Market Capitalization to GDP The U.S. equity market cap to GDP ratio is near an all-time high at approximately 187%, suggesting a significant overvaluation of the U.S. stock market. Image: Goldman Sachs Global Investment Research

S&P 500 and the Percentage of Stocks Above 10-Day MAs

S&P 500 and the Percentage of Stocks Above 10-Day MAs The rise in the percentage of S&P 500 stocks above their 10-day moving averages can be interpreted as a tactical bullish divergence, providing valuable insights into market strength and the potential for a reversal. Image: BofA Global Research

Global Equity Valuations

Global Equity Valuations The current market environment reflects a contrast between relatively cheap Emerging Markets (EM) and Developed Markets (DM) ex-U.S., and expensive U.S. stock valuations. Image: Topdown Charts

Secular Bull Market Analogs and S&P 500

Secular Bull Market Analogs and S&P 500 Since the Great Recession, U.S. stocks have behaved like a secular bull market, which is characterized by an extended period of growth and rising prices. Image: BofA Global Research