Conference Board 1-Year Expectation Stock Prices Increase vs. S&P 500

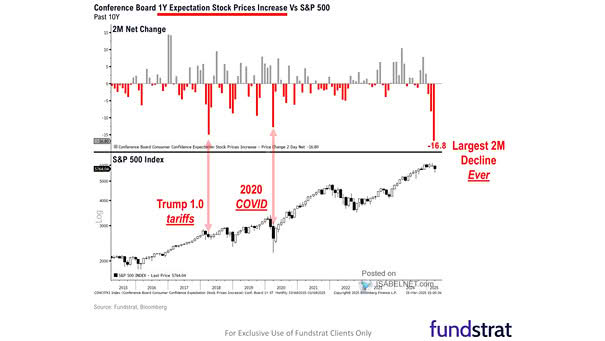
Conference Board 1-Year Expectation Stock Prices Increase vs. S&P 500 The Conference Board’s latest Consumer Confidence survey reveals the sharpest two-month drop in stock market expectations—a level of pessimism that historically signals a contrarian buying opportunity. Image: Fundstrat Global Advisors, LLC

Market Capitalization of the Largest Stock Relative to the 75th Percentile Stock

Market Capitalization of the Largest Stock Relative to the 75th Percentile Stock The U.S. equity market is experiencing historically high levels of concentration, primarily driven by the dominance of a small group of mega-cap tech companies. This concentration is at levels not seen in nearly a century. Image: Goldman Sachs Global Investment Research

Magnificent Seven Stocks vs. Unprofitable Tech

Magnificent Seven Stocks vs. Unprofitable Tech The Magnificent 7’s market dominance may be waning, at least in the short-term, as unprofitable tech stocks have recently outperformed these tech giants, indicating a broader market expansion. Image: Goldman Sachs Global Investment Research

Median Stock Short Interest as Share of Market Capitalization

Median Stock Short Interest as Share of Market Capitalization While the S&P 500’s median short interest is currently low by historical standards, Consumer Staples, Utilities, and Health Care sectors are notable exceptions, showing elevated short interest compared to their 30-year historical averages. Image: Goldman Sachs Global Investment Research

Market Capitalization of the S&P 493 as Share of Index Total

Market Capitalization of the S&P 493 as Share of Index Total The 493 smallest stocks in the S&P 500 now account for just 67% of the index’s market capitalization, a record low. This reflects a trend where a few large companies dominate, raising concerns about market concentration. Image: Goldman Sachs Global Investment Research

Seven Largest Companies as Share of S&P 500 Total Market Capitalization

Seven Largest Companies as Share of S&P 500 Total Market Capitalization The seven largest stocks in the S&P 500 index account for 33% of its total market capitalization. While this high concentration doesn’t necessarily predict market downturns, it can potentially lead to increased volatility. Image: Goldman Sachs Global Investment Research

S&P 500 Top 5 Stocks’ Weight vs. 1-Year Forward Returns

S&P 500 Top 5 Stocks’ Weight vs. 1-Year Forward Returns While the current high market concentration is a significant feature of today’s market landscape, it doesn’t necessarily predict poor performance in the near term. Image: Goldman Sachs Global Investment Research

U.S. Stocks – Magnificent Seven Market Value as a Percent of S&P 500 Market Value

U.S. Stocks – Magnificent Seven Market Value as a Percent of S&P 500 Market Value The “Magnificent Seven” stocks have significantly influenced the S&P 500, now accounting for 34% of its market capitalization, reflecting their dominance and the concentrated risk in the market. Image: Goldman Sachs Global Investment Research

S&P 500 Market Concentration vs. 10-Year Annualized Forward Returns

S&P 500 Market Concentration vs. 10-Year Annualized Forward Returns High concentration in the S&P 500 may boost short-term performance, but it often signals lower future returns, particularly during non-recessionary periods. Image: Goldman Sachs Global Investment Research

Market – Breadth Index

Market – Breadth Index With the Goldman Sachs Breadth Index at 21, it remains below the 30-year average of 35, indicating that fewer stocks are contributing to market gains. Image: Goldman Sachs Global Investment Research

Performance – U.S. Small Cap Stocks vs. Large Cap Stocks

Performance – U.S. Small Cap Stocks vs. Large Cap Stocks Small caps continue to face significant challenges relative to large caps, a trend that has persisted for several years. However, there is a growing sense of cautious optimism about their potential recovery as market conditions change. Image: BofA Global Research