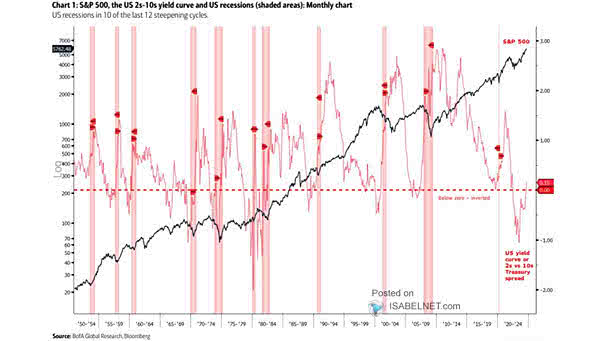
S&P 500 and U.S. 2s-10s Yield Curve
S&P 500 and U.S. 2s-10s Yield Curve Since the late 1950s, 10 of the last 12 yield curve steepening cycles have coincided with U.S. recessions, highlighting the yield curve’s effectiveness as a predictor of economic downturns. Image: BofA Global Research