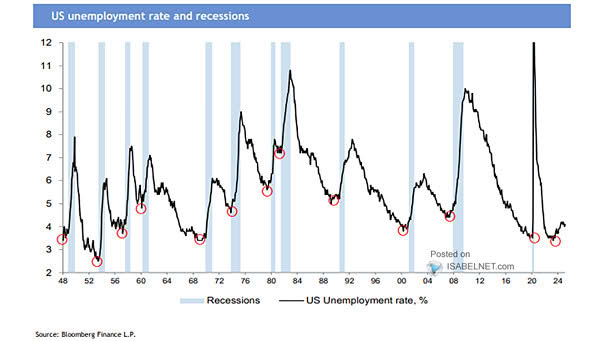
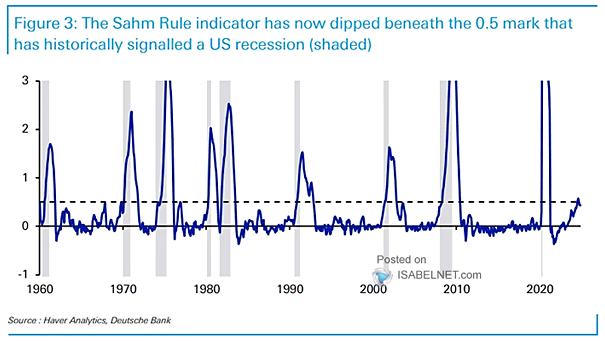
U.S. Nonfarm Payroll Growth and Unemployment Rate
U.S. Nonfarm Payroll Growth and Unemployment Rate Goldman Sachs expects new lows in the U.S. unemployment rate in 2020. Image: Goldman Sachs Global Investment Research
Volatility of U.S. GDP Growth, Inflation and Unemployment Rates Interesting chart showing the decline in volatility of the U.S. economy that occurred in the 1980s. Image: Goldman Sachs Global Investment Research
U.S. Misery Index (Unemployment Rate + Core Inflation) The misery index is an economic indicator, created by economist Arthur Okun. Because both inflation and unemployment are very low, the U.S. misery index (unemployment rate + core inflation) is approaching all-time low. That’s good news for Americans, because it brings stability to the life of the…
Business Cycle – U.S. Output Gap and Unemployment Rate Chart suggesting that the US economy has slipped into the late stage of the business cycle. Image: Quill Intelligence, LLC
U.S. New Heavy Truck Sales Lead U.S. Unemployment Rate Chart suggesting that U.S. new heavy truck sales lead the U.S. unemployment rate by 7 months. Image: Pictet Wealth Management
U.S. State Unemployment Rates The unemployment rate is increasing in some states. Image: The Wall Street Journal
MSCI World Index vs. OECD Unemployment Rate and U.S. Consumer Confidence Chart suggesting that OECD unemployment troughs and very confident U.S. consumers do not generally bode well for global equities. Image: Morgan Stanley Research
San Francisco Fed Leading Unemployment Rate Does the San Francisco Fed Leading Unemployment Rate signal a turning point in the U.S. labor market? Image: Merk Investments
University of Michigan Consumer Sentiment Index Leads U.S. Unemployment Rate This chart suggests that the University of Michigan Consumer Sentiment Index leads the U.S. unemployment rate by 9 months. An R² of 0.80 is quite high and significant. Image: Deutsche Bank
U.S. and Eurozone Unemployment Rates This chart shows the gap between the unemployment rates of the two economies, while unemployment falls to historic lows. Image: Financial Times