Funds Flow – Fixed Income and Equities
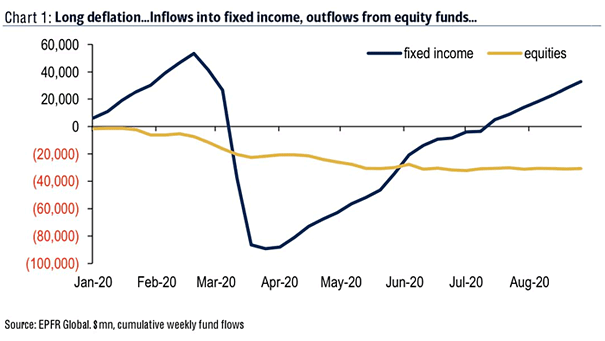
Funds Flow – Fixed Income and Equities Fixed income funds continue to recover, but equity funds experienced 22 weeks of outflows this year. Image: BofA
Funds Flow – Fixed Income and Equities Fixed income funds continue to recover, but equity funds experienced 22 weeks of outflows this year. Image: BofA
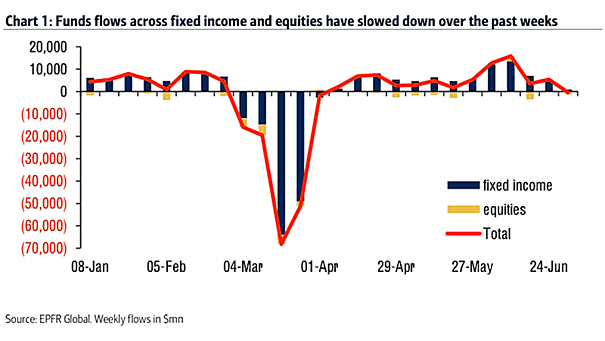
Funds Flows – Fixed Income and Equities Funds flows across fixed income and equities continued to slow for a third week. Image: BofA Global Research

Global Cumulative Weekly Flow: Fixed Income vs. Equities This chart highlights once again investors’ strong preference for bonds. Image: BofA Global Research
Global Fixed Income Market In Different Yield Buckets Nowadays, the scarcity of yield with 20% of global bonds below 0%. Image: ICE Data Indices, Bank of America Merrill Lynch
Flows – Fixed-Income Assets Flows into Treasury-Inflation Protected Securities (TIPS) funds have been very strong, as they offer investors protection against rising inflation. Image: BofA Global Research
Asset Growth in Global ETF Fixed-Income The incredible rise of fixed-income exchange-traded funds puts pressure on banks. Image: Financial Times
U.S. Share of Global Investment-Grade Fixed-Income Yield With negative yields in Europe and Japan, the U.S. now accounts for 95% of the positive investment-grade yield. Image: Legg Mason
U.S. Households’ (Incl. Hedge Fund) Asset Allocation U.S. households are currently heavily overweight in equities relative to fixed income, reflecting strong conviction in U.S. equity markets despite ongoing economic uncertainties and cautious positioning in bonds. Image: Deutsche Bank
CTAs Exposure to Bonds CTAs’ overall allocation to bonds in the 8th percentile indicates a relatively low exposure to fixed income securities. Image: Deutsche Bank Asset Allocation
U.S. Business Cycle – Cross-Asset Cycle Indicator The Morgan Stanley’s U.S. cycle indicator has moved into the downturn phase. Should investors favor fixed income over equities? Image: Morgan Stanley Research
U.S. Fund Flows Flows into U.S. stock funds remain strong, while U.S. fixed income fund flows are still negative. Image: Topdown Charts