Energy Prices vs. Fed Rate Cuts
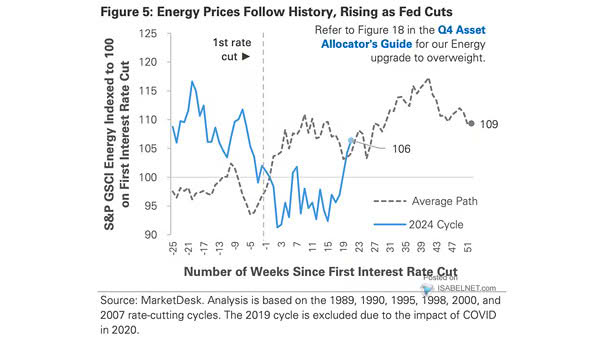
Energy Prices vs. Fed Rate Cuts Energy prices have historically risen after the Federal Reserve begins cutting interest rates. Image: MarketDesk Research
Energy Prices vs. Fed Rate Cuts Energy prices have historically risen after the Federal Reserve begins cutting interest rates. Image: MarketDesk Research
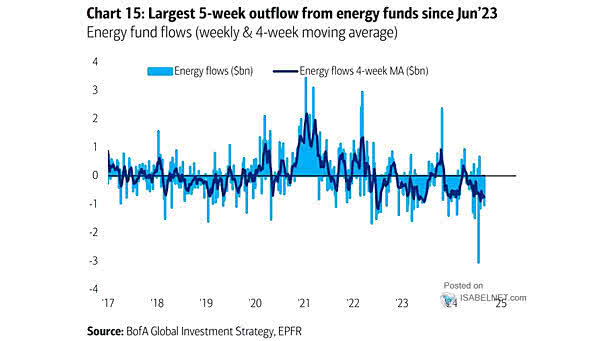
Weekly Energy Flows Energy funds are facing substantial outflows, driven by investor concerns over growth and policy uncertainties. Image: BofA Global Investment Strategy

Tech/Telecom/Healthcare vs. Financials/Energy/Materials as % of Global Equities Should long-term investors consider buying the dip in sectors such as Financials, Energy, or Materials? Image: BofA Global Investment Strategy
S&P 500 Quarterly Net Profit Margin (Ex. Financials & Energy) Consensus forecasts indicate that S&P 500 profit margins will remain near record highs in 2025, supported by steady earnings growth and strong economic expansion. Image: Goldman Sachs Global Investment Research
Energy Group Positioning Energy positioning in the 62nd percentile is still far from extreme. Image: Deutsche Bank Asset Allocation
Energy vs. S&P 500, Relative Price Performance Should investors consider overweighting their exposure to energy stocks in their portfolios? Image: BofA Global Investment Strategy
Energy vs. Consumer Discretionary Stocks Should investors remain long energy stocks? Image: BofA Global Investment Strategy
U.S. Energy Equities vs. U.S. Tech Sector Equities Should investors continue to overweight U.S. energy equities? Image: Goldman Sachs Global Investment Research
Resources (Energy + Materials) Flows Will resources (energy + materials) continue to experience inflows? Image: BofA Global Investment Strategy
FMS Investors – Net % Overweight Energy FMS investors continue to overweight energy. Image: BofA Global Fund Manager Survey
Consensus Net Income – S&P 500 vs. S&P 500 ex Energy Have U.S. equities fully priced in the risk of recession? Image: Morgan Stanley Research